

Question: Here are comparative financial statement data for Oriole Company and Kimberly Company, two competitors. All data are as of December 31, 2022, and December 31,
Here are comparative financial statement data for Oriole Company and Kimberly Company, two competitors. All data are as of December 31, 2022, and December 31, 2021.
Thank you!
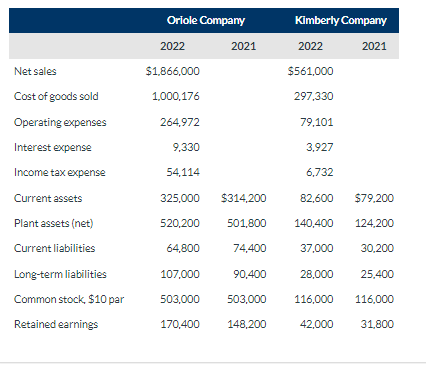
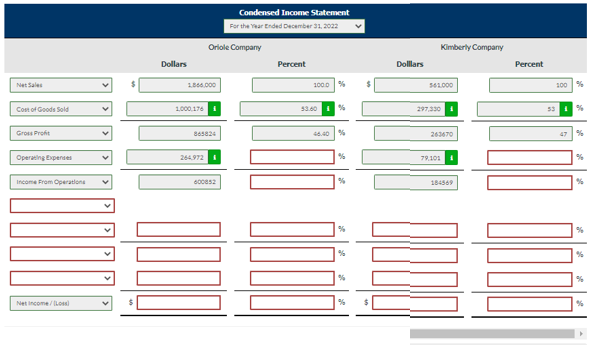
Oriole Company Kimberly Company 2022 2021 2022 2021 Net sales $1,866,000 $561,000 $ 1,000,176 297,330 Cost of goods sold Operating expenses 264,972 79.101 Interest expense 9,330 3,927 Income tax expense 54,114 6,732 Current assets 325,000 $314,200 82,600 $79,200 520,200 501,800 124,200 64,800 74,400 30,200 Plant assets (net) Current liabilities Long-term liabilities Common stock, $10 par Retained earnings 140,400 37.000 28,000 116,000 107,000 90,400 25.400 503,000 503,000 116,000 170,400 148.200 42.000 31.800 Condensed Income Statement For the Year Ended December 31, 2022 Oriole Company Kimberly Company Dollars Percent Dollars Percent Net Sales 2.368.000 1000% 561.000 100 Cost of Goods Sold 1.000196 53.60 297.330 33 1 Gross Profit 865824 6.00 26.3670 47 Operating Expenses 264972 79.101 Income From Operations 600852 184569 90 % 000g QUI! % Net Income / Los % 9
Step by Step Solution
There are 3 Steps involved in it

Get step-by-step solutions from verified subject matter experts