

Question: Here are comparative financial statement data for Swifty Company and Susan Company, two competitors. All data are as of December 31, 2022, and December 31,
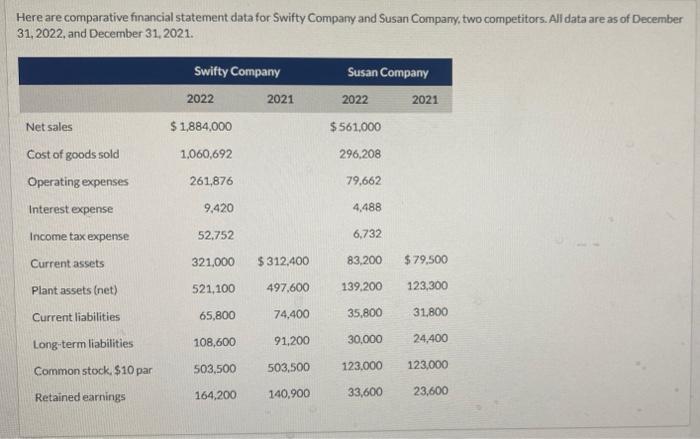
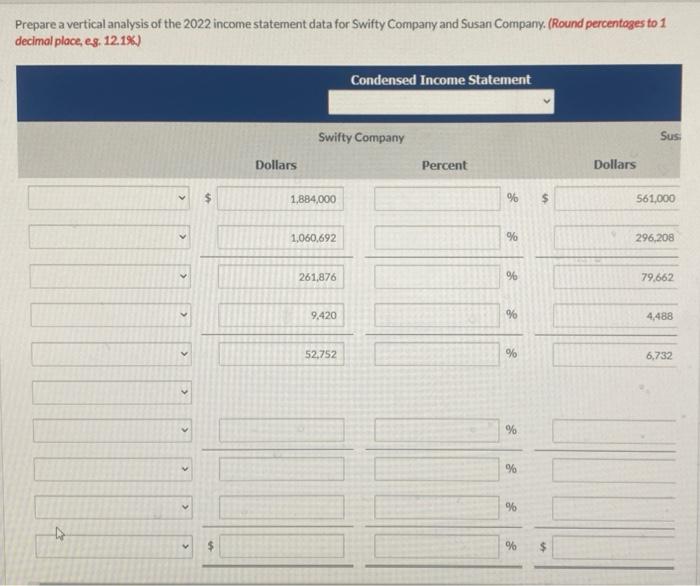
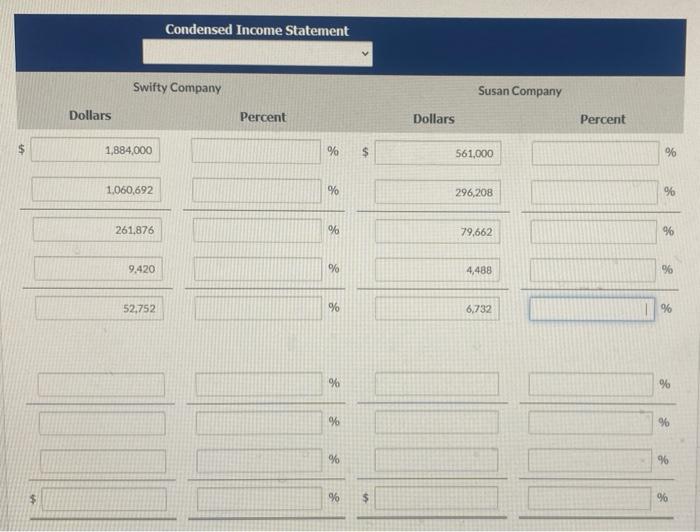
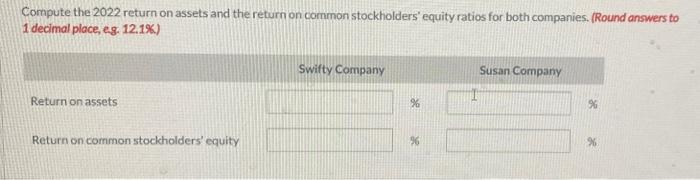
Here are comparative financial statement data for Swifty Company and Susan Company, two competitors. All data are as of December 31, 2022, and December 31, 2021. Swifty Company 2022 2021 Susan Company 2022 2021 $561,000 Net sales $1,884,000 Cost of goods sold 1,060,692 296.208 Operating expenses 261,876 79,662 Interest expense 9,420 4,488 Income tax expense 52.752 6,732 Current assets 321,000 $ 312,400 83.200 $ 79,500 Plant assets (net) 521,100 497.600 139,200 123,300 Current liabilities 65,800 74,400 35,800 31,800 108,600 91,200 30.000 Long-term liabilities 24,400 Common stock. $10 par 503.500 503,500 123.000 123,000 Retained earnings 164,200 140,900 33,600 23,600 Prepare a vertical analysis of the 2022 income statement data for Swifty Company and Susan Company. (Round percentages to 1 decimal place, eg. 12.1%) Condensed Income Statement Swifty Company Sus Dollars Percent Dollars 1,884,000 % $ 561,000 1,060,692 % 296,208 > 261,876 96 79.662 52,752 % 6,732 % % % % Condensed Income Statement Swifty Company Susan Company Dollars Percent Dollars Percent $ 1,884,000 % $ 561.000 % 1.060,692 % 296,208 % 261,876 % 79,662 % 9.420 % 4,488 % 52,752 % 6,732 % % % % % % % % 96 $ % $ % Compute the 2022 return on assets and the return on common stockholders' equity ratios for both companies. (Round answers to 1 decimal place, eg. 12.1%) Swifty Company Susan Company Return on assets % % Return on common stockholders' equity %6
Step by Step Solution
There are 3 Steps involved in it

Get step-by-step solutions from verified subject matter experts