

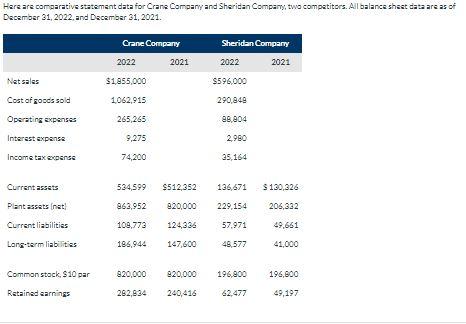
Here are comparative statemant data for Crane Company and Sheridan Company, two compatitors. All balanca shast...
Fantastic news! We've Found the answer you've been seeking!
Question:

Transcribed Image Text:
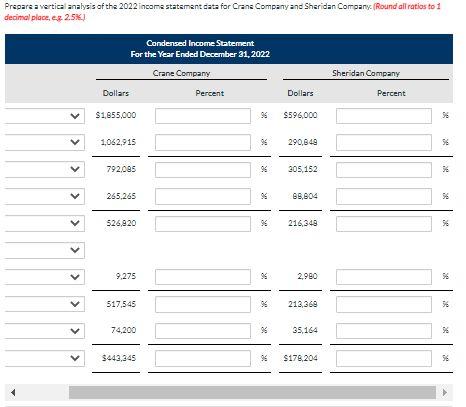
Here are comparative statemant data for Crane Company and Sheridan Company, two compatitors. All balanca shast data ars as of December 31, 2022. and December 31, 2021. Crane Company Sheridan Company 2022 2021 2022 2021 Nat sales $1855,000 596,000 Cost of goods sold 1062,915 290,848 Operating expanses 265,265 88,804 Interest expense 9,275 2.980 Income tax expense 74,200 25,164 Current assats 534,599 $512,352 136,671 $130,326 Plant assats (nat 863,952 820,000 229,154 206,332 Current liabilities 108,773 124,336 57,971 49,661 Lang-term liabilitias 186,944 147,600 48,577 41,000 Common stock, $10 par 820,000 820,000 196,800 196,800 Retained sarnings 282,834 240,416 62,477 49,197 Prepars a vertical anaiysis of the 2022 income statament data for Crana Company and Sharidan Company. (Round all ratios to 1 decimal place, eg 25K) Condensed Income Statement For the Year Ended December 31, 2022 Crane Company Sheridan Compan Dollars Percent Dollars Perce $1855,000 596,000 1,062,915 290,848 792,085 305,152 265,265 6,804 526,820 216,348 9,275 2,980 517,545 213,369 74,200 35,164 $443,345 $178,204 > > > Prepare a vertical analysis of the 2022 income statsment data for Crans Company and Sharidan Company: (Round all ratios to 1 decimal place, eg 2.5K) Condensed Income Statement For the Year Ended December 31, 2022 Crane Company Sheridan Company Dollars Percent Dollars Percent $1855,000 % $596,000 1,062,915 290,648 792.085 305,152 265,265 68,804 526,820 216,348 56 9.275 2,980 517,545 213,369 74,200 35,164 S43,345 S178,204 > Here are comparative statemant data for Crane Company and Sheridan Company, two compatitors. All balanca shast data ars as of December 31, 2022. and December 31, 2021. Crane Company Sheridan Company 2022 2021 2022 2021 Nat sales $1855,000 596,000 Cost of goods sold 1062,915 290,848 Operating expanses 265,265 88,804 Interest expense 9,275 2.980 Income tax expense 74,200 25,164 Current assats 534,599 $512,352 136,671 $130,326 Plant assats (nat 863,952 820,000 229,154 206,332 Current liabilities 108,773 124,336 57,971 49,661 Lang-term liabilitias 186,944 147,600 48,577 41,000 Common stock, $10 par 820,000 820,000 196,800 196,800 Retained sarnings 282,834 240,416 62,477 49,197 Prepars a vertical anaiysis of the 2022 income statament data for Crana Company and Sharidan Company. (Round all ratios to 1 decimal place, eg 25K) Condensed Income Statement For the Year Ended December 31, 2022 Crane Company Sheridan Compan Dollars Percent Dollars Perce $1855,000 596,000 1,062,915 290,848 792,085 305,152 265,265 6,804 526,820 216,348 9,275 2,980 517,545 213,369 74,200 35,164 $443,345 $178,204 > > > Prepare a vertical analysis of the 2022 income statsment data for Crans Company and Sharidan Company: (Round all ratios to 1 decimal place, eg 2.5K) Condensed Income Statement For the Year Ended December 31, 2022 Crane Company Sheridan Company Dollars Percent Dollars Percent $1855,000 % $596,000 1,062,915 290,648 792.085 305,152 265,265 68,804 526,820 216,348 56 9.275 2,980 517,545 213,369 74,200 35,164 S43,345 S178,204 > Here are comparative statemant data for Crane Company and Sheridan Company, two compatitors. All balanca shast data ars as of December 31, 2022. and December 31, 2021. Crane Company Sheridan Company 2022 2021 2022 2021 Nat sales $1855,000 596,000 Cost of goods sold 1062,915 290,848 Operating expanses 265,265 88,804 Interest expense 9,275 2.980 Income tax expense 74,200 25,164 Current assats 534,599 $512,352 136,671 $130,326 Plant assats (nat 863,952 820,000 229,154 206,332 Current liabilities 108,773 124,336 57,971 49,661 Lang-term liabilitias 186,944 147,600 48,577 41,000 Common stock, $10 par 820,000 820,000 196,800 196,800 Retained sarnings 282,834 240,416 62,477 49,197 Prepars a vertical anaiysis of the 2022 income statament data for Crana Company and Sharidan Company. (Round all ratios to 1 decimal place, eg 25K) Condensed Income Statement For the Year Ended December 31, 2022 Crane Company Sheridan Compan Dollars Percent Dollars Perce $1855,000 596,000 1,062,915 290,848 792,085 305,152 265,265 6,804 526,820 216,348 9,275 2,980 517,545 213,369 74,200 35,164 $443,345 $178,204 > > > Prepare a vertical analysis of the 2022 income statsment data for Crans Company and Sharidan Company: (Round all ratios to 1 decimal place, eg 2.5K) Condensed Income Statement For the Year Ended December 31, 2022 Crane Company Sheridan Company Dollars Percent Dollars Percent $1855,000 % $596,000 1,062,915 290,648 792.085 305,152 265,265 68,804 526,820 216,348 56 9.275 2,980 517,545 213,369 74,200 35,164 S43,345 S178,204 > Here are comparative statemant data for Crane Company and Sheridan Company, two compatitors. All balanca shast data ars as of December 31, 2022. and December 31, 2021. Crane Company Sheridan Company 2022 2021 2022 2021 Nat sales $1855,000 596,000 Cost of goods sold 1062,915 290,848 Operating expanses 265,265 88,804 Interest expense 9,275 2.980 Income tax expense 74,200 25,164 Current assats 534,599 $512,352 136,671 $130,326 Plant assats (nat 863,952 820,000 229,154 206,332 Current liabilities 108,773 124,336 57,971 49,661 Lang-term liabilitias 186,944 147,600 48,577 41,000 Common stock, $10 par 820,000 820,000 196,800 196,800 Retained sarnings 282,834 240,416 62,477 49,197 Prepars a vertical anaiysis of the 2022 income statament data for Crana Company and Sharidan Company. (Round all ratios to 1 decimal place, eg 25K) Condensed Income Statement For the Year Ended December 31, 2022 Crane Company Sheridan Compan Dollars Percent Dollars Perce $1855,000 596,000 1,062,915 290,848 792,085 305,152 265,265 6,804 526,820 216,348 9,275 2,980 517,545 213,369 74,200 35,164 $443,345 $178,204 > > > Prepare a vertical analysis of the 2022 income statsment data for Crans Company and Sharidan Company: (Round all ratios to 1 decimal place, eg 2.5K) Condensed Income Statement For the Year Ended December 31, 2022 Crane Company Sheridan Company Dollars Percent Dollars Percent $1855,000 % $596,000 1,062,915 290,648 792.085 305,152 265,265 68,804 526,820 216,348 56 9.275 2,980 517,545 213,369 74,200 35,164 S43,345 S178,204 > Here are comparative statemant data for Crane Company and Sheridan Company, two compatitors. All balanca shast data ars as of December 31, 2022. and December 31, 2021. Crane Company Sheridan Company 2022 2021 2022 2021 Nat sales $1855,000 596,000 Cost of goods sold 1062,915 290,848 Operating expanses 265,265 88,804 Interest expense 9,275 2.980 Income tax expense 74,200 25,164 Current assats 534,599 $512,352 136,671 $130,326 Plant assats (nat 863,952 820,000 229,154 206,332 Current liabilities 108,773 124,336 57,971 49,661 Lang-term liabilitias 186,944 147,600 48,577 41,000 Common stock, $10 par 820,000 820,000 196,800 196,800 Retained sarnings 282,834 240,416 62,477 49,197 Prepars a vertical anaiysis of the 2022 income statament data for Crana Company and Sharidan Company. (Round all ratios to 1 decimal place, eg 25K) Condensed Income Statement For the Year Ended December 31, 2022 Crane Company Sheridan Compan Dollars Percent Dollars Perce $1855,000 596,000 1,062,915 290,848 792,085 305,152 265,265 6,804 526,820 216,348 9,275 2,980 517,545 213,369 74,200 35,164 $443,345 $178,204 > > > Prepare a vertical analysis of the 2022 income statsment data for Crans Company and Sharidan Company: (Round all ratios to 1 decimal place, eg 2.5K) Condensed Income Statement For the Year Ended December 31, 2022 Crane Company Sheridan Company Dollars Percent Dollars Percent $1855,000 % $596,000 1,062,915 290,648 792.085 305,152 265,265 68,804 526,820 216,348 56 9.275 2,980 517,545 213,369 74,200 35,164 S43,345 S178,204 > Here are comparative statemant data for Crane Company and Sheridan Company, two compatitors. All balanca shast data ars as of December 31, 2022. and December 31, 2021. Crane Company Sheridan Company 2022 2021 2022 2021 Nat sales $1855,000 596,000 Cost of goods sold 1062,915 290,848 Operating expanses 265,265 88,804 Interest expense 9,275 2.980 Income tax expense 74,200 25,164 Current assats 534,599 $512,352 136,671 $130,326 Plant assats (nat 863,952 820,000 229,154 206,332 Current liabilities 108,773 124,336 57,971 49,661 Lang-term liabilitias 186,944 147,600 48,577 41,000 Common stock, $10 par 820,000 820,000 196,800 196,800 Retained sarnings 282,834 240,416 62,477 49,197 Prepars a vertical anaiysis of the 2022 income statament data for Crana Company and Sharidan Company. (Round all ratios to 1 decimal place, eg 25K) Condensed Income Statement For the Year Ended December 31, 2022 Crane Company Sheridan Compan Dollars Percent Dollars Perce $1855,000 596,000 1,062,915 290,848 792,085 305,152 265,265 6,804 526,820 216,348 9,275 2,980 517,545 213,369 74,200 35,164 $443,345 $178,204 > > > Prepare a vertical analysis of the 2022 income statsment data for Crans Company and Sharidan Company: (Round all ratios to 1 decimal place, eg 2.5K) Condensed Income Statement For the Year Ended December 31, 2022 Crane Company Sheridan Company Dollars Percent Dollars Percent $1855,000 % $596,000 1,062,915 290,648 792.085 305,152 265,265 68,804 526,820 216,348 56 9.275 2,980 517,545 213,369 74,200 35,164 S43,345 S178,204 >
Expert Answer:
Answer rating: 100% (QA)
Crane Company Sheridan Company Dollars Percent Dollars Percent Net sales 1855000 596000 1000 1000 Co... View the full answer

Related Book For 
Accounting for Governmental and Nonprofit Entities
ISBN: 978-0078025822
17th edition
Authors: Jacqueline Reck, Suzanne Lowensohn, Earl Wilson
Posted Date:
Students also viewed these accounting questions
-
The condensed balance sheets as of December 31 for Rice and Associates and Rachel Excavation are as follows: As of December 31, the market values of Rachels inventories and property, plant, and...
-
The condensed balance sheets as of December 31 for Rice and Associated and Rachel Excavation are as follows: As of December 31, the market values of Rachel's inventories and fixed assets were $70,000...
-
As of December 31 20XX, Michael Corp's fixed assets before depreciation were 14,000,000 Its sales for the year were 32,000,000 Its EBIT for 20XX was 1,500,000 and its accumulated depreciation on...
-
please help with the entire question asap please thank you!! 12. ABC Manufacturing Company has the following data for 2024 (amounts in millions): EIE (Cick the icon to viow the information.) Prepare...
-
The spending variance can be separated into two components. Name and briefly describe them.
-
Use inductive reasoning to form a conjecture about whether the sum of an even integer and an odd integer is even or odd. Then use deductive reasoning to show that the conjecture is true.
-
Sample wealth (in billions of dollars) for billionaires in Africa and Asia are listed. Find the coefficient of variation for each of the two data sets. Then compare the results. Africa 12.2 7.7 7.2...
-
Out Camping is a manufacturer of supplies and has several divisions, one of which is the tent division that produces that deluxe tent Away From Home. Fourteen thousand of these tents are made each...
-
Some laboratory testing returned the parameters: Poisson's ratio for the sand and clay is 0.3 Young's modulus of the sand is 10 MPa Coefficient of compressibility of clay is 0.8 MPa-1 Void ratio...
-
Prevosti Farms and Sugarhouse pays its employees according to their job classification. The following employees make up Sugarhouse's staff: Employee Number Name and Address Payroll information...
-
Convert 57EC to decimal notation. 16 10
-
Refer to 3-24. Jaimes business policy is to plan to end each month with an ending inventory equal to 20 per cent of the next months projected sales. Jaimes pays $8 for each hat that it purchases....
-
Wivenhoe Wines is based in the Brisbane Valley and makes boutique wines sold online to customers on credit (70% of sales) and to customers visiting the vineyard and purchasing bottles of wine at the...
-
Helenas Chocolates is preparing a sales budget for the quarter (3 months) AprilJune 202X for their gift chocolate box product and a schedule of cash collections. The majority of their sales are cash...
-
Information technology has penetrated nearly all aspects of life in advanced nations, unlike many developing countries. This leads some people to say that technology widens the development gap...
-
The following table shows the demand and supply of boxed lunch meals per day at a small local restaurant. a. Graph the demand and supply curves. b. Compute consumer surplus, producer surplus, and...
-
1. Which one of the following types of inventory accounts would be used by a wholesaler or retailer? a. Raw materials inventory b. Work in process inventory c. Finished goods inventory d. Merchandise...
-
Data 9.2 on page 540 introduces the dataset Cereal, which includes information on the number of grams of fiber in a serving for 30 different breakfast cereals. The cereals come from three different...
-
What criteria must be met before a not-for-profit organization can record donated services? If the criteria are met, how should donated services be recorded? Give examples to support your answer.
-
What are the three categories into which NFPs must classify their net assets? Describe which net assets are included in each category. Would board-designated net assets be reported as temporarily...
-
At the end of fiscal year 2017, the City of Columbus General Fund pre-adjusting trial balance showed the following balances for operating and budgetary accounts and fund balance accounts. The City of...
-
Due to the Covid recession of 2020, the U.S. government budget changed from smaller deficits to very large deficits. What impact would this have on the net exports and private sector balances, all...
-
Verify the log-likelihood in equation (16.4) for the Tobit model. In L = = In { 1-0 (x-di)} 1:y=di 122. + (y; - x) 02 (16.4) i:y;>di
-
Verify the likelihood in equation (16.5) for the two-part model. n2. (16.5) -(-)-(-2)/02 L = [] {(p;)" (1 p; )'-'} [[ ( i=1 ri=1

Study smarter with the SolutionInn App