

Question: Here are comparative statement data for Cullumber Company and Oriole Company, two competitors. All balance sheet data are as of December 31, 2022, and December
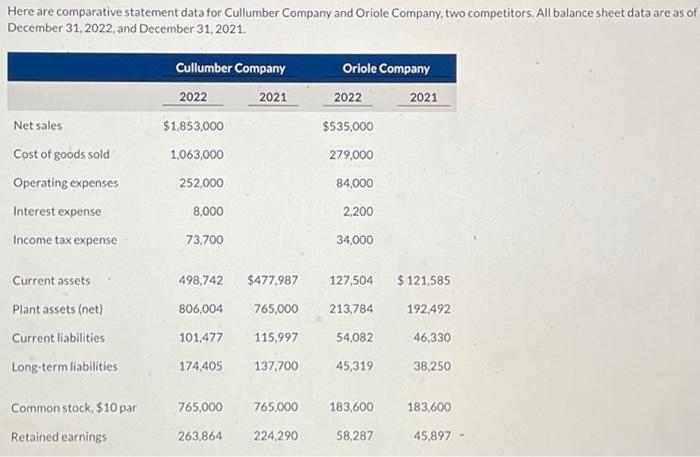
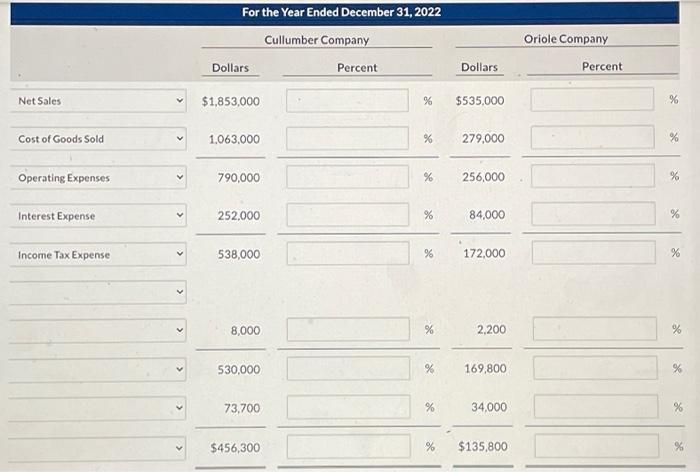
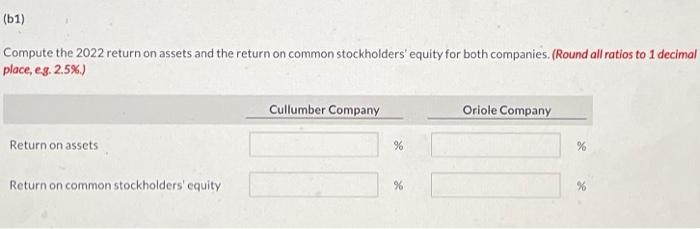
Here are comparative statement data for Cullumber Company and Oriole Company, two competitors. All balance sheet data are as of December 31, 2022, and December 31, 2021. Cullumber Company 2022 2021 $1,853,000 Oriole Company 2022 2021 Net sales $535,000 1,063,000 279.000 252,000 84,000 Cost of goods sold Operating expenses Interest expense Income tax expense 8,000 2,200 73,700 34,000 498,742 $477.987 127,504 $ 121,585 806,004 765,000 213,784 192,492 Current assets Plant assets (net) Current liabilities Long-term liabilities 101,477 115,997 54,082 46,330 174,405 137,700 45,319 38,250 Common stock, $10 par 765,000 765,000 183,600 183,600 Retained earnings 263,864 224,290 58,287 45,897 For the Year Ended December 31, 2022 Cullumber Company Dollars Percent Oriole Company Dollars Percent Net Sales $1,853,000 % $535,000 % Cost of Goods Sold v 1,063,000 % 279,000 se Operating Expenses V 790,000 % 256,000 % Interest Expense 252,000 % 84,000 Income Tax Expense 538,000 % 172,000 % 8,000 % 2.200 530,000 % 169,800 % 73,700 % % 34,000 % $456,300 % $135,800 * (61) Compute the 2022 return on assets and the return on common stockholders' equity for both companies. (Round all ratios to 1 decimal place, eg. 2.5%) Cullumber Company Oriole Company Return on assets % % Return on common stockholders' equity 96
Step by Step Solution
There are 3 Steps involved in it

Get step-by-step solutions from verified subject matter experts