

Question: Here are comparative statement data for Sandhill Company and Carla Vista Company, two competitors. All balance sheet data are as of December 31, 2022, and
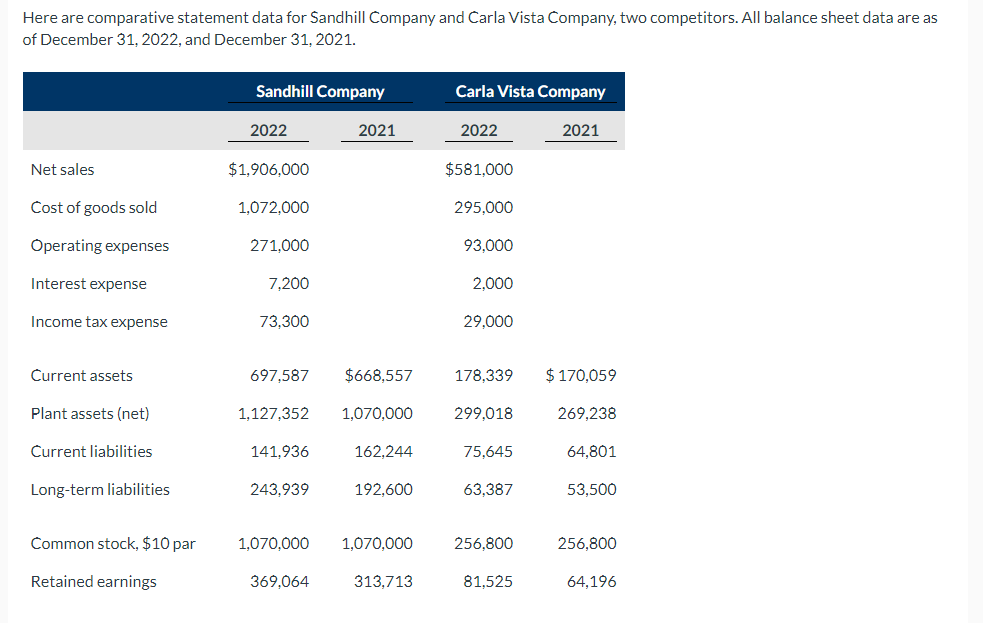
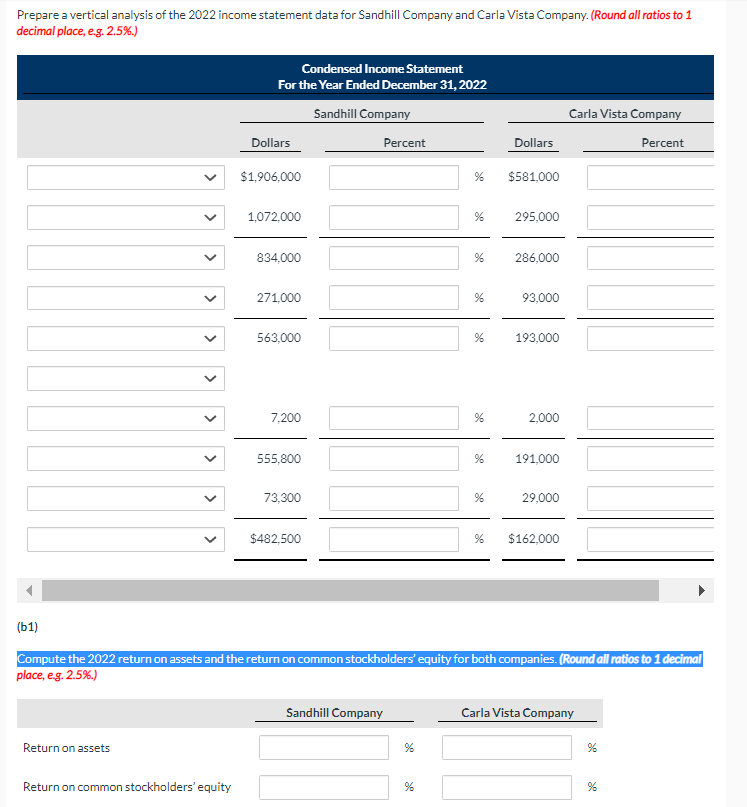
Here are comparative statement data for Sandhill Company and Carla Vista Company, two competitors. All balance sheet data are as of December 31, 2022, and December 31, 2021. Sandhill Company Carla Vista Company 2022 2021 2022 2021 Net sales $1,906,000 $581,000 Cost of goods sold 1,072,000 295.000 Operating expenses 271,000 93,000 Interest expense 7,200 2,000 Income tax expense 73,300 29,000 Current assets 697,587 $668,557 178,339 $ 170,059 Plant assets (net) 1,127,352 1,070,000 299,018 269,238 Current liabilities 141,936 162,244 75,645 64,801 Long-term liabilities 243.939 192,600 63,387 53,500 Common stock, $10 par 1,070,000 1,070,000 256,800 256,800 Retained earnings 369.064 313.713 81,525 64,196 Prepare a vertical analysis of the 2022 income statement data for Sandhill Company and Carla Vista Company. (Round all ratios to 1 decimal place, e.g. 2.5%.) Condensed Income Statement For the Year Ended December 31, 2022 Sandhill Company Carla Vista Company Dollars Percent Dollars Percent $1.906,000 % $581,000 1,072,000 % 295,000 834.000 % 286,000 271.000 % 93,000 563,000 % 193.000 7,200 % 2,000 555,800 % 191.000 > 73,300 % 29,000 > $482,500 % $162,000 (61) Compute the 2022 return on assets and the return on common stockholders' equity for both companies. (Round all ratios to 1 decimal place, e.g. 2.5%.) Sandhill Company Carla Vista Company Return on assets % % Return on common stockholders' equity %
Step by Step Solution
There are 3 Steps involved in it

Get step-by-step solutions from verified subject matter experts