

Question: Here are five scatterplots, each with its least squares regression line. 20 0 60 30 20 10 0 10 10 0 10 1520 30 20
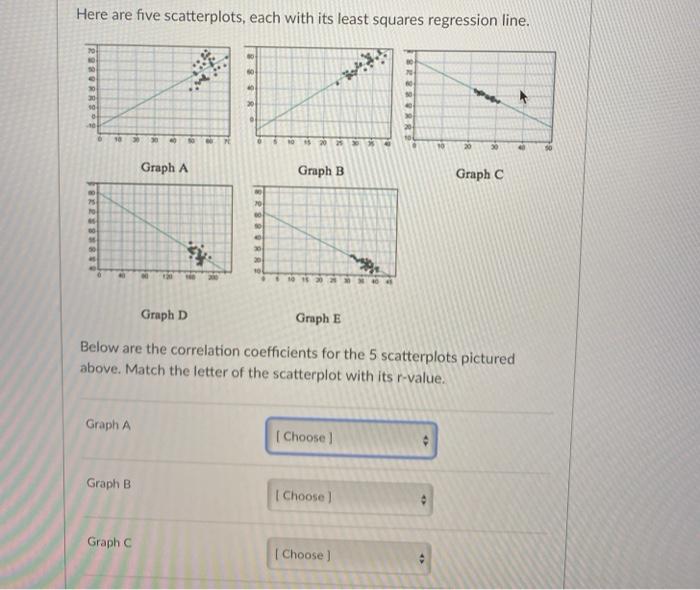
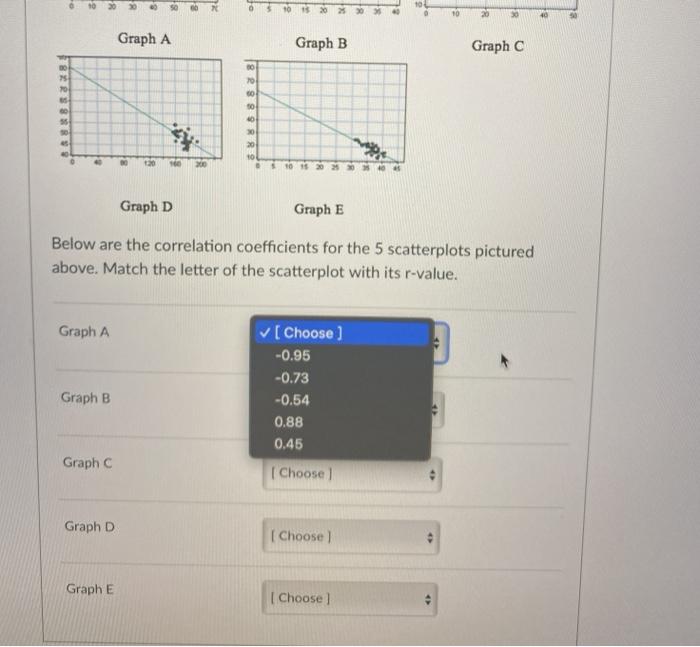
Here are five scatterplots, each with its least squares regression line. 20 0 60 30 20 10 0 10 10 0 10 1520 30 20 30 Graph A Graph B Graph 75 20 50 00 50 20 10 2 10 Graph D Graph E Below are the correlation coefficients for the 5 scatterplots pictured above. Match the letter of the scatterplot with its r-value. Graph A Choose Graph B I Choose Graph Choose) 7 ta 10 15 20 > > 10 20 30 Graph A Graph B Graph C 70 70 50 55 30 20 5 10 15 20 30 Graph D Graph E Below are the correlation coefficients for the 5 scatterplots pictured above. Match the letter of the scatterplot with its r-value. Graph A [Choose) -0.95 -0.73 -0.54 0.88 0.45 Graph B Graph Choose Graph D [Choose Graph E [Choose
Step by Step Solution
There are 3 Steps involved in it

Get step-by-step solutions from verified subject matter experts