

Question: Here are my questions DATA Set: Indicate one: Apartments Directions: Fill in the answer to the questions posed below. Attach the specified printouts where indicated
Here are my questions
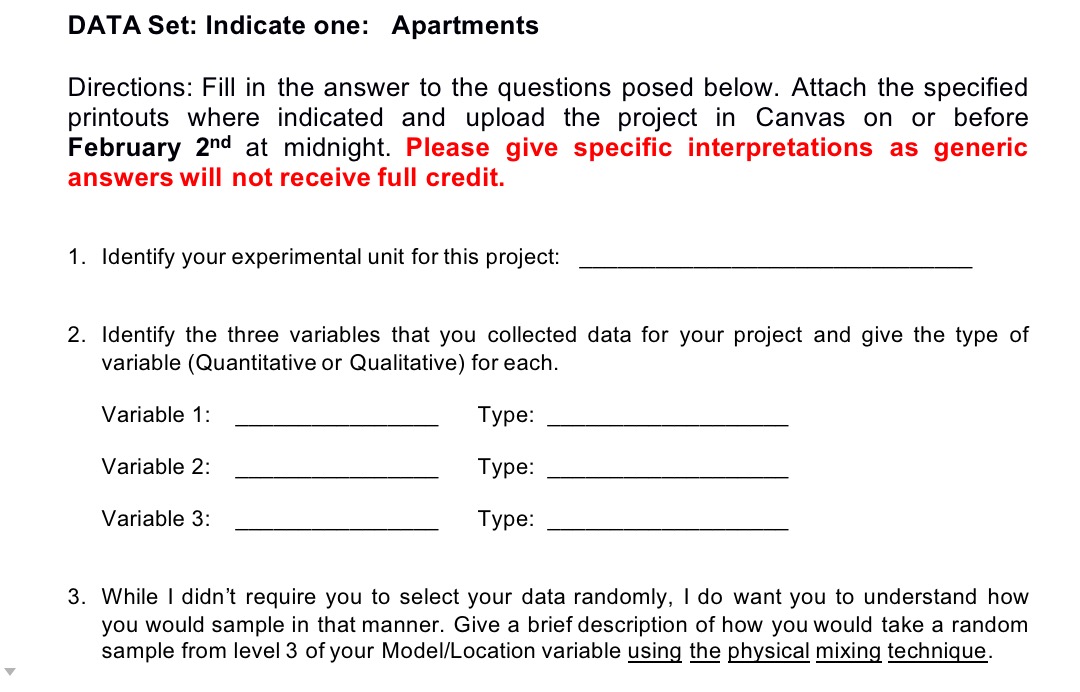
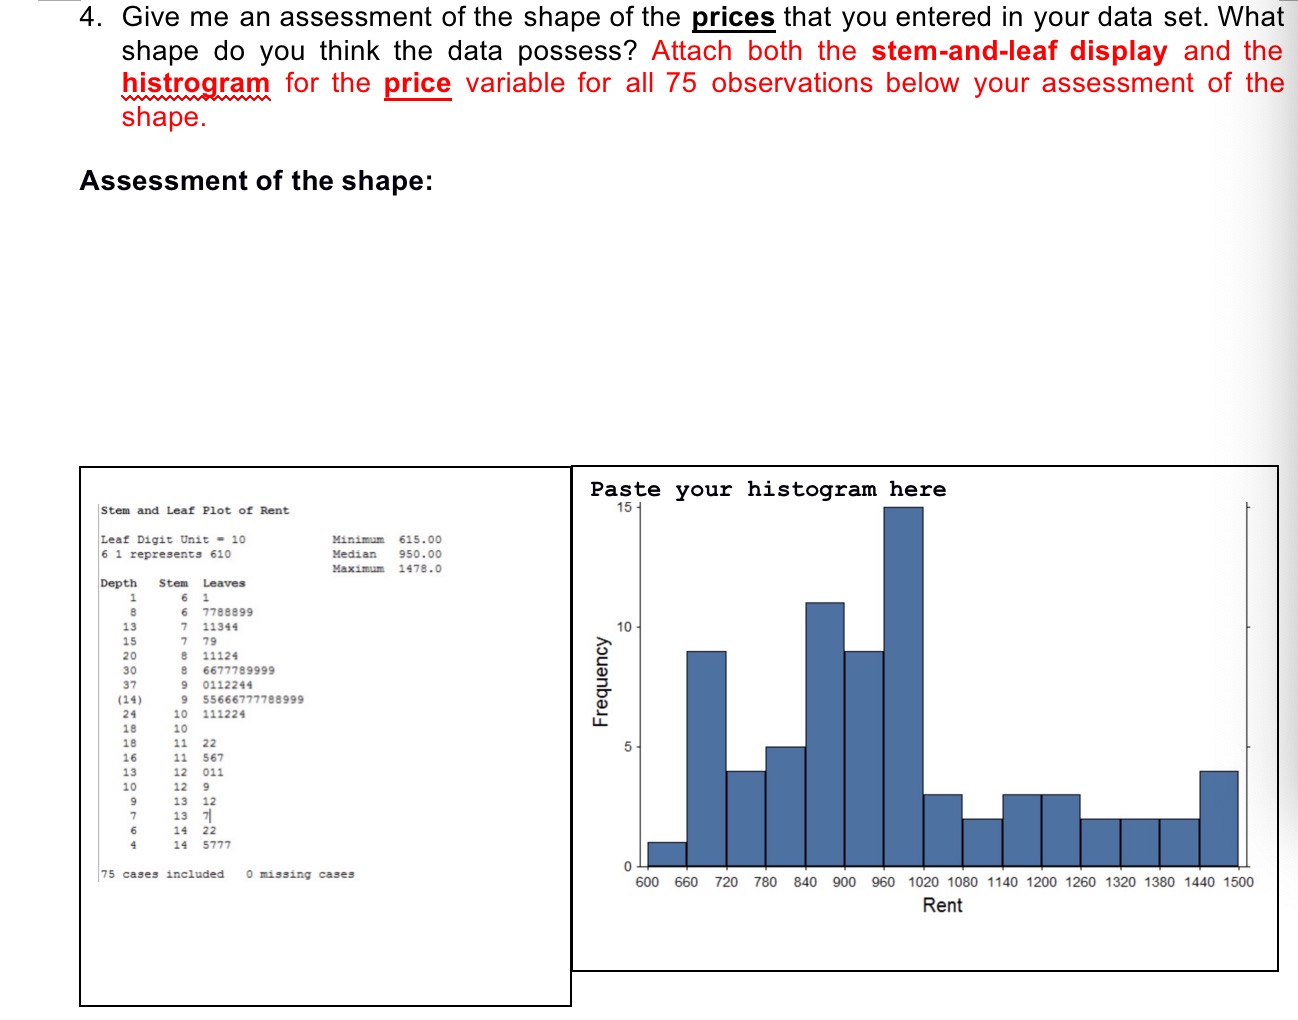
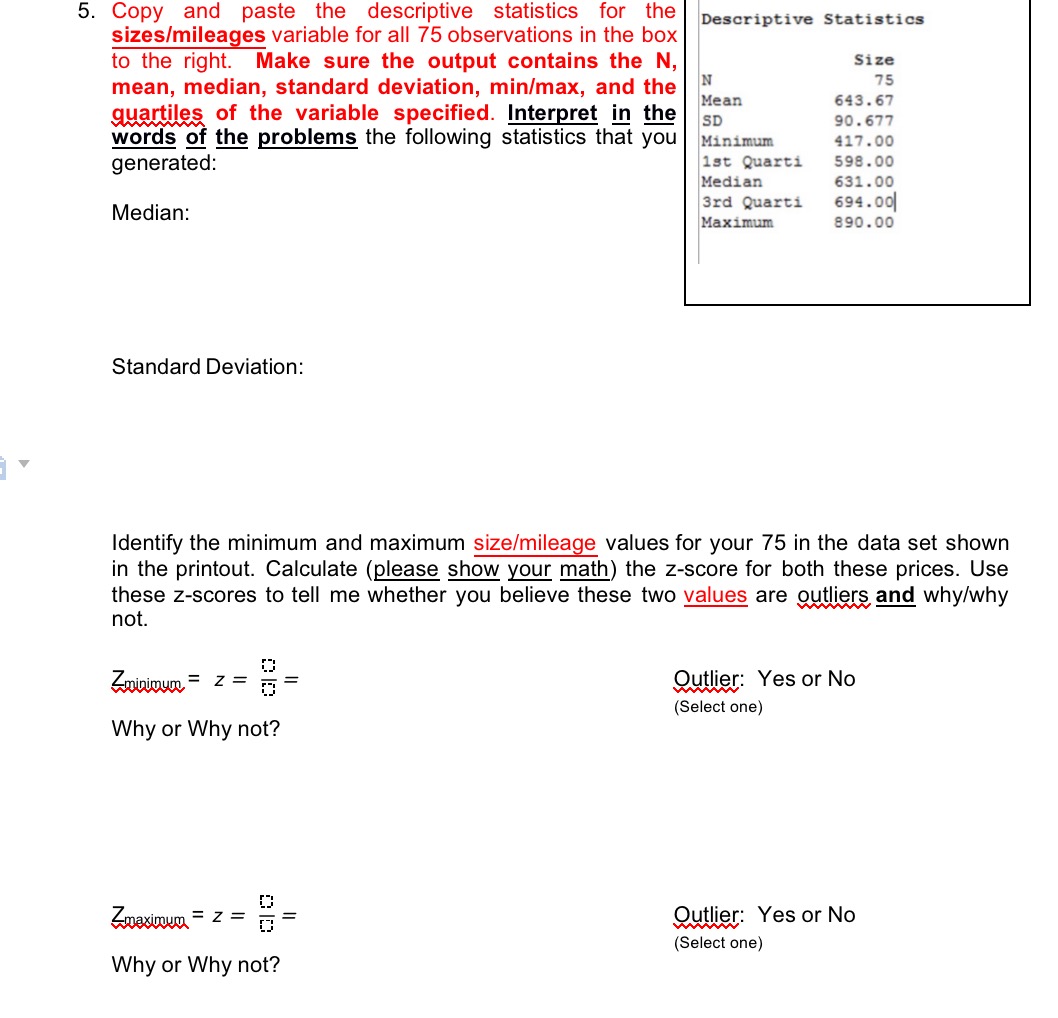
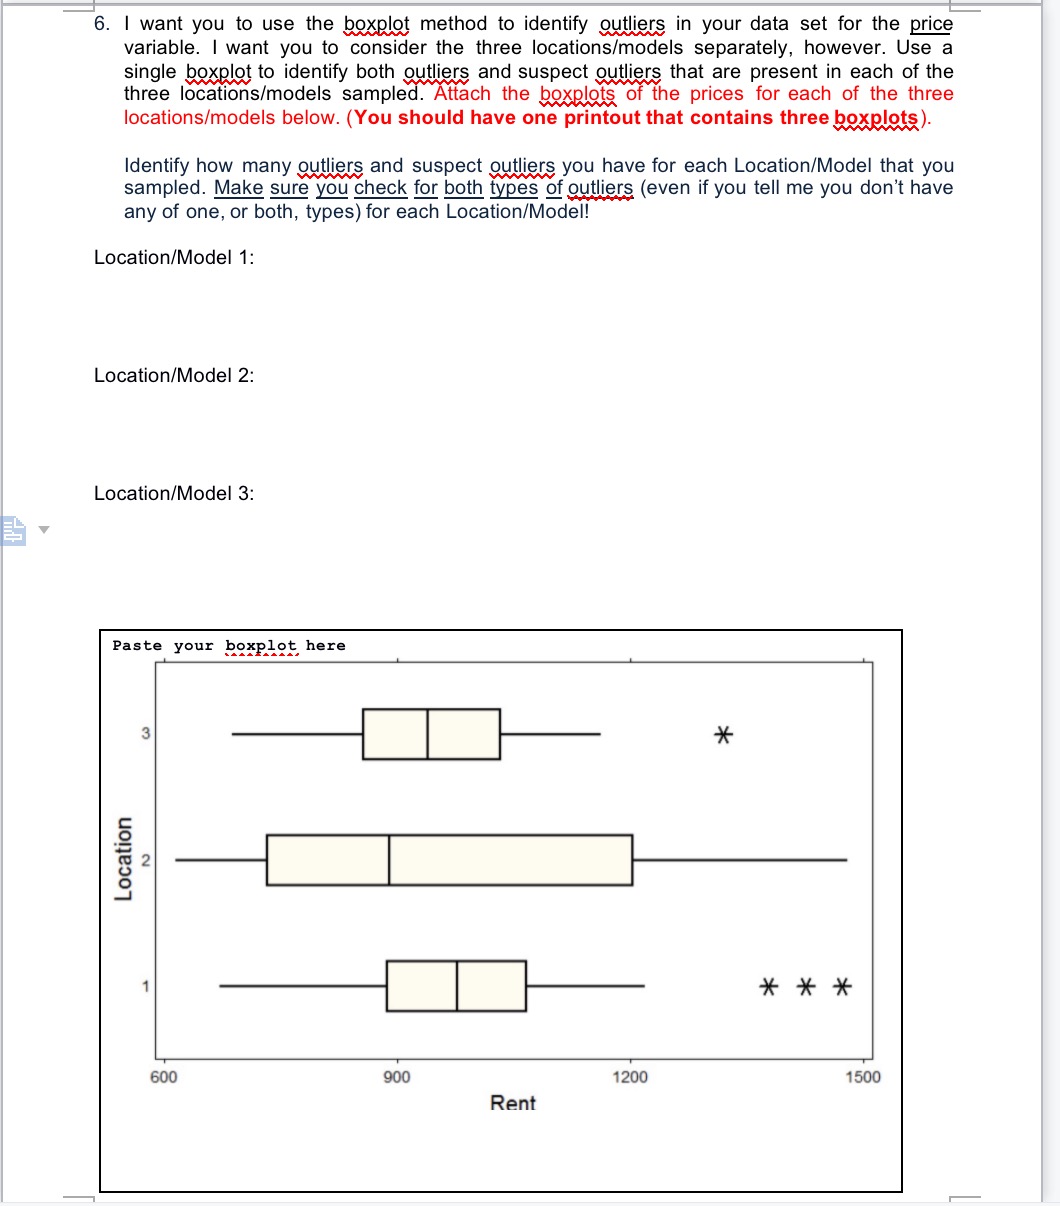
DATA Set: Indicate one: Apartments Directions: Fill in the answer to the questions posed below. Attach the specified printouts where indicated and upload the project in Canvas on or before February 2nd at midnight. Please give specific interpretations as generic answers will not receive full credit. 1. Identify your experimental unit for this project: 2. Identify the three variables that you collected data for your project and give the type of variable (Quantitative or Qualitative) for each. Variable 1: Type: Variable 2: Type: Variable 3: Type: 3. While I didn't require you to select your data randomly, I do want you to understand how you would sample in that manner. Give a brief description of how you would take a random sample from level 3 of your Model/Location variable using the physical mixing technique.4. Give me an assessment of the shape of the prices that you entered in your data set. What shape do you think the data possess? Attach both the stem-and-leaf display and the histrogram for the price variable for all 75 observations below your assessment of the shape. Assessment of the shape: Paste your histogram here Stem and Leaf Plot of Rent 15 Leaf Digit Unit = 10 Minimum 615.00 6 1 represents 610 Median 950.00 Maximum 1478.0 Depth Stem Leaves 1 6 1 A 7788899 13 7 11344 10 15 79 20 8 11124 30 8 6677789999 37 9 0112244 Frequency 14) 9 55666777788999 24 10 111224 18 10 18 11 22 16 11 567 5 . 13 12 011 10 12 9 13 12 13 7 14 22 4 14 5777 75 cases included 0 missing cases 600 660 720 780 840 900 960 1020 1080 1140 1200 1260 1320 1380 1440 1500 Rent5. Copy and paste the descriptive statistics for the Descriptive Statistics sizes/mileages variable for all 75 observations in the box to the right. Make sure the output contains the N, Size mean, median, standard deviation, min/max, and the N 75 Mean 643.67 quartiles of the variable specified. Interpret in the SD 90. 677 words of the problems the following statistics that you Minimum 417.00 generated: ist Quarti 598.00 Median 631.00 Median: 3rd Quarti 694.00 Maximum 890.00 Standard Deviation: Identify the minimum and maximum size/mileage values for your 75 in the data set shown in the printout. Calculate (please show your math) the z-score for both these prices. Use these z-scores to tell me whether you believe these two values are outliers and why/why not. Zinioun = Z= Qutlier: Yes or No Select one) Why or Why not? Outlier: Yes or No (Select one) Why or Why not?6. I want you to use the boxplot method to identify outliers in your data set for the price variable. I want you to consider the three locations/models separately, however. Use a single boxplot to identify both outliers and suspect outliers that are present in each of the three locations/models sampled. Attach the boxplots of the prices for each of the three locations/models below. (You should have one printout that contains three boxplots Identify how many outliers and suspect outliers you have for each Location/Model that you sampled. Make sure you check for both types of outliers (even if you tell me you don't have any of one, or both, types) for each Location/Model! Location/Model 1: Location/Model 2: Location/Model 3: Paste your boxplot here 3 * Location N * * * 600 900 1200 1500 Rent
Step by Step Solution
There are 3 Steps involved in it

Get step-by-step solutions from verified subject matter experts