

Question: Here are the actual numbers used to plot the triangles for the double-time-arrival model in Figure 2-4 Replication hrfarmanee Measure 1 2 3 4 5
Here are the actual numbers used to plot the triangles for the double-time-arrival model in Figure 2-4
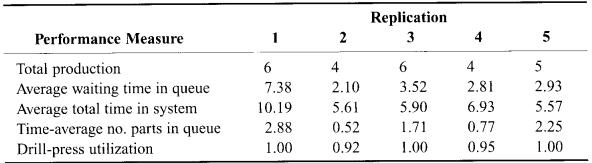
Replication hrfarmanee Measure 1 2 3 4 5 Total production 15 4 15 4 5 Average waiting time in queue 2.30 2.10 3.52 2.31 2.93 Average total time in system 10.19 5.51 5.90 15.93 5.57:' Time-average no. parts in queue 2.33 0.52 1.21 0.22 2.25 Drill-press utilizatien 1.00 0.92 1.00 0.95 1.00
Step by Step Solution
There are 3 Steps involved in it
1 Expert Approved Answer
Step: 1 Unlock

Question Has Been Solved by an Expert!
Get step-by-step solutions from verified subject matter experts
Step: 2 Unlock
Step: 3 Unlock