

Question: Here are the boxplot and the 5- number summaries for these distribution Here are the boxplots and the 5-number summaries for these distributions again. male
Here are the boxplot and the 5- number summaries for these distribution
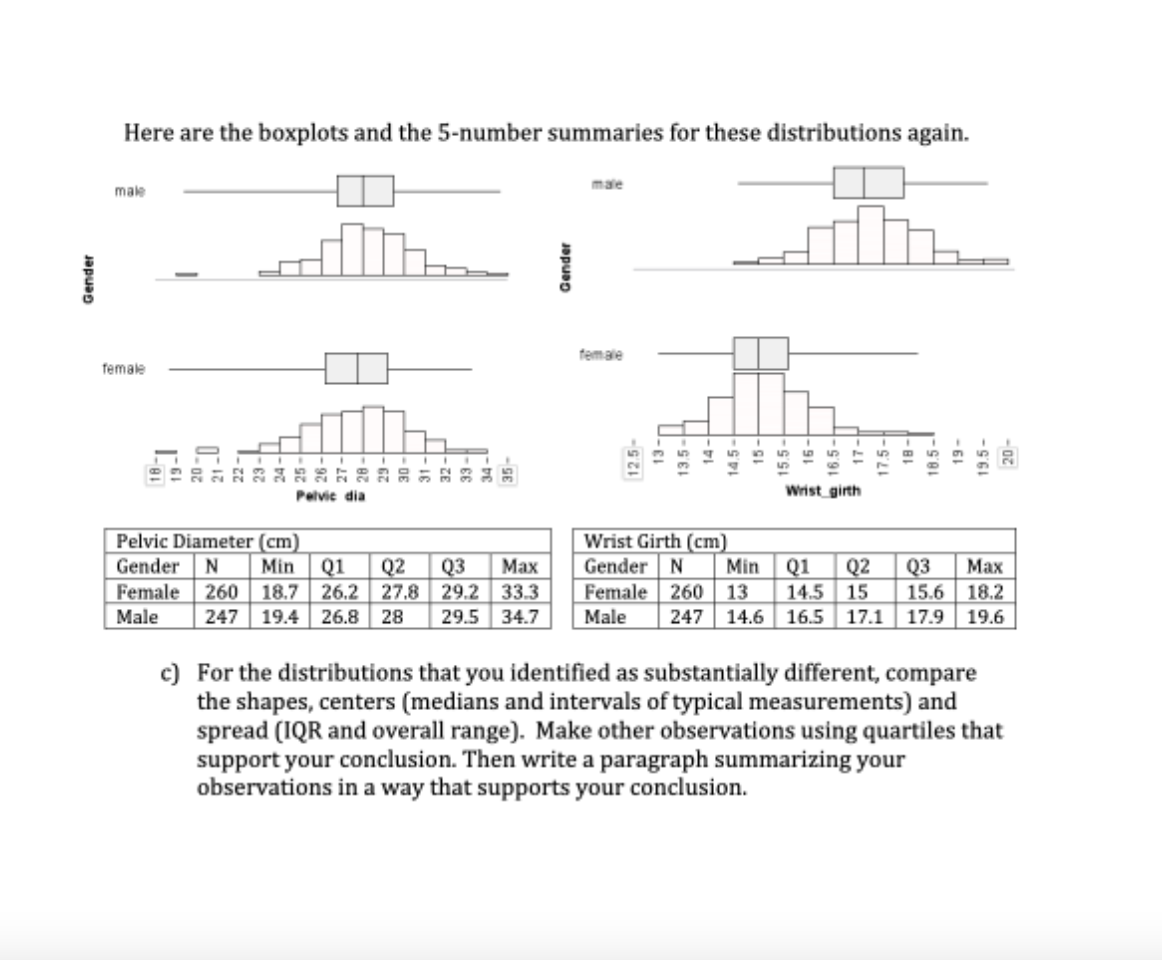
Here are the boxplots and the 5-number summaries for these distributions again. male mate Gender Gender female female 2 13.5 - 5.5- 20- 14.5- 16.5- 17.5- 18.5- 19.5 - 12.5 Pelvic dia Wrist_girth Pelvic Diameter (cm) Wrist Girth (cm] Gender N Min Q1 Q2 Q3 Max Gender N Min Q1 Q2 Q3 Max Female 260 18.7 26.2 27.8 29.2 33.3 Female 260 |13 14.5 15 15.6 18.2 Male 247 19.4 26.8 28 29.5 34.7 Male 247 14.6 16.5 17.1 17.9 19.6 c) For the distributions that you identified as substantially different, compare the shapes, centers (medians and intervals of typical measurements) and spread (IQR and overall range). Make other observations using quartiles that support your conclusion. Then write a paragraph summarizing your observations in a way that supports your conclusion
Step by Step Solution
There are 3 Steps involved in it

Get step-by-step solutions from verified subject matter experts