

Question: HERE ARE THE DETAILED EXPLANATION OF THE PROGRAM FROM CHAPTER 1 YOU DO NOT NEED THE FILE, I JUST NEED TO KNOW HOW TO SET
HERE ARE THE DETAILED EXPLANATION OF THE PROGRAM FROM CHAPTER 1
YOU DO NOT NEED THE FILE, I JUST NEED TO KNOW HOW TO SET IT UP AND PLEASE ANSWER ALL THE QUESTIONS THAT THEY ARE ASKING. THANK YOU.
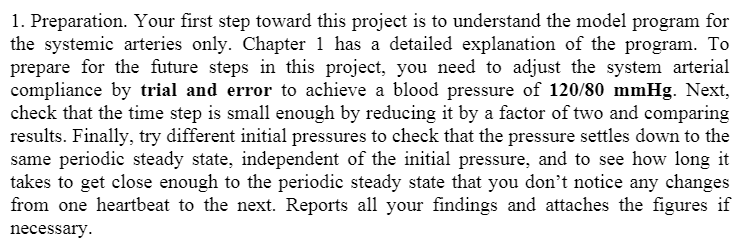
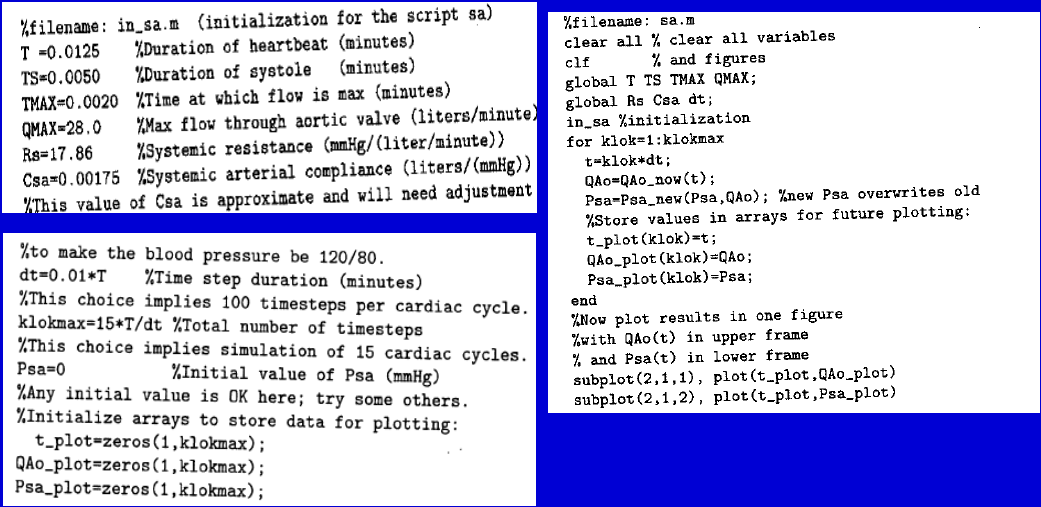
1. Preparation. Your first step toward this project is to understand the model program for the systemic arteries only. Chapter 1 has a detailed explanation of the program. To prepare for the future steps in this project, you need to adjust the system arterial compliance by trial and error to achieve a blood pressure of 120/80 mmHg. Next, check that the time step is small enough by reducing it by a factor of two and comparing results. Finally, try different initial pressures to check that the pressure settles down to the same periodic steady state, independent of the initial pressure, and to see how long it takes to get close enough to the periodic steady state that you don't notice any changes from one heartbeat to the next. Reports all your findings and attaches the figures if necessary. %filename: in_sa.m (initialization for the script sa) T=0.0125 %Duration of heartbeat (minutes) TS=0.0050 %Duration of systole (minutes) TMAX=0.0020 %Time at which flow is max (minutes) QMAX=28.0 %Max flow through aortic valve (liters/minute) Rs=17.86 %Systemic resistance (mmHg/(liter/minute)) Csa=0.00175 %Systemic arterial compliance (liters/(mmHg)) This value of Csa is approximate and will need adjustment %filename: sa. clear all % clear all variables clf % and figures global T TS TMAX QMAX; global Rs Csa at; in_sa %initialization for klok=1: klokmax t-klok*dt; QAO=QAO_now(t); Psa-Psa_new(Psa, QA0); %new Psa overwrites old %Store values in arrays for future plotting: t-plot (klok)=t; QAo-plot (klok)=QA0; Psa_plot (klok)=Psa; end %Now plot results in one figure %with QAo(t) in upper frame % and Psa(t) in lower frame subplot(2,1,1), plot(t_plot,QA0_plot) subplot (2,1,2), plot(t_plot,Psa_plot) %to make the blood pressure be 120/80. dt=0.01*T %Time step duration (minutes) %This choice implies 100 timesteps per cardiac cycle. klokmax=15*T/dt %Total number of timesteps %This choice implies simulation of 15 cardiac cycles. Psa=0 %Initial value of Psa (mmHg) %Any initial value is OK here; try some others. %Initialize arrays to store data for plotting: t-plot-zeros(1, klokmax); QAo-plot-zeros(1, klokmax); Psa_plot-zeros(1, klokmax); 1. Preparation. Your first step toward this project is to understand the model program for the systemic arteries only. Chapter 1 has a detailed explanation of the program. To prepare for the future steps in this project, you need to adjust the system arterial compliance by trial and error to achieve a blood pressure of 120/80 mmHg. Next, check that the time step is small enough by reducing it by a factor of two and comparing results. Finally, try different initial pressures to check that the pressure settles down to the same periodic steady state, independent of the initial pressure, and to see how long it takes to get close enough to the periodic steady state that you don't notice any changes from one heartbeat to the next. Reports all your findings and attaches the figures if necessary. %filename: in_sa.m (initialization for the script sa) T=0.0125 %Duration of heartbeat (minutes) TS=0.0050 %Duration of systole (minutes) TMAX=0.0020 %Time at which flow is max (minutes) QMAX=28.0 %Max flow through aortic valve (liters/minute) Rs=17.86 %Systemic resistance (mmHg/(liter/minute)) Csa=0.00175 %Systemic arterial compliance (liters/(mmHg)) This value of Csa is approximate and will need adjustment %filename: sa. clear all % clear all variables clf % and figures global T TS TMAX QMAX; global Rs Csa at; in_sa %initialization for klok=1: klokmax t-klok*dt; QAO=QAO_now(t); Psa-Psa_new(Psa, QA0); %new Psa overwrites old %Store values in arrays for future plotting: t-plot (klok)=t; QAo-plot (klok)=QA0; Psa_plot (klok)=Psa; end %Now plot results in one figure %with QAo(t) in upper frame % and Psa(t) in lower frame subplot(2,1,1), plot(t_plot,QA0_plot) subplot (2,1,2), plot(t_plot,Psa_plot) %to make the blood pressure be 120/80. dt=0.01*T %Time step duration (minutes) %This choice implies 100 timesteps per cardiac cycle. klokmax=15*T/dt %Total number of timesteps %This choice implies simulation of 15 cardiac cycles. Psa=0 %Initial value of Psa (mmHg) %Any initial value is OK here; try some others. %Initialize arrays to store data for plotting: t-plot-zeros(1, klokmax); QAo-plot-zeros(1, klokmax); Psa_plot-zeros(1, klokmax)
Step by Step Solution
There are 3 Steps involved in it

Get step-by-step solutions from verified subject matter experts