

Question: Here are the numbers, I just need help with the formulas for the 2012 and 2013 financial ratios and how to get those numbers.(Sales growth
Here are the numbers, I just need help with the formulas for the 2012 and 2013 financial ratios and how to get those numbers.(Sales growth to Non current liab/sales)
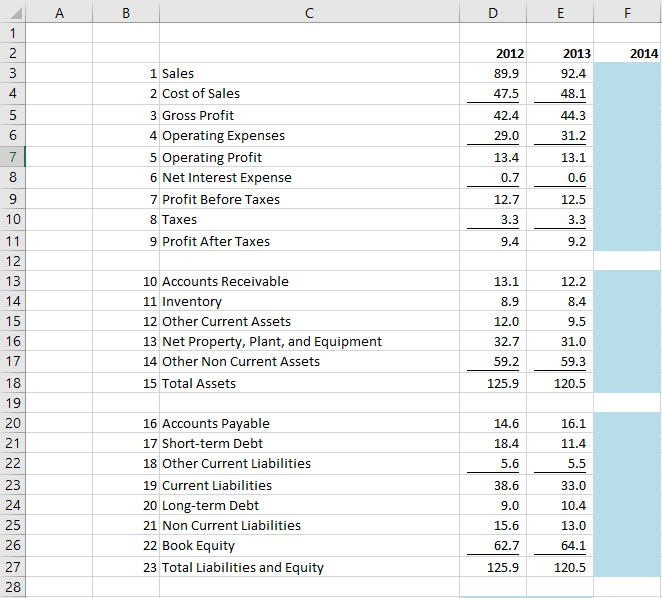
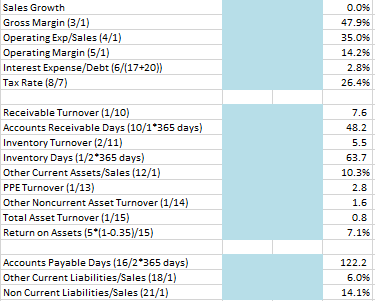
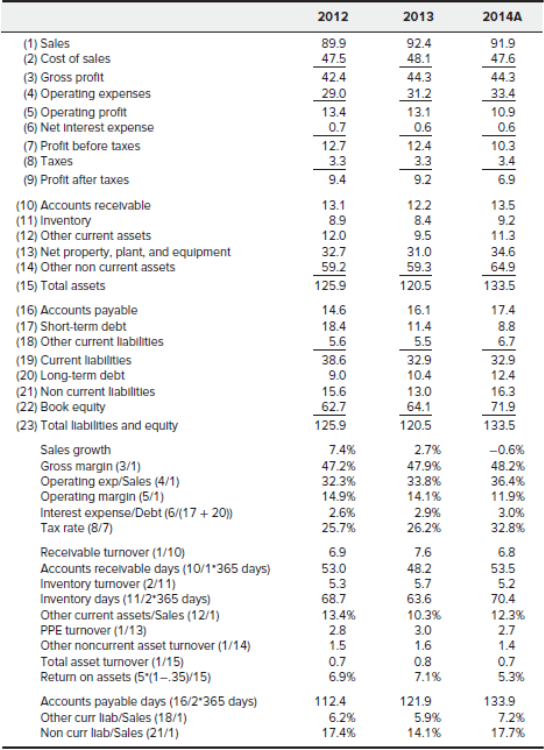
A B D E F 1 2014 2 3 4 5 6 2012 89.9 47.5 2013 92.4 48.1 42.4 44.3 29.0 31.2 1 Sales 2 Cost of Sales 3 Gross Profit 4 Operating Expenses 5 Operating Profit 6 Net Interest Expense 7 Profit Before Taxes 8 Taxes 9 Profit After Taxes 13.4 0.7 13.1 0.6 8 12.5 9 10 12.7 3.3 3.3 11 9.4 9.2 13.1 8.9 10 Accounts Receivable 11 Inventory 12 Other Current Assets 13 Net Property, Plant, and Equipment 14 Other Non Current Assets 15 Total Assets 12.2 8.4 9.5 31.0 12.0 32.7 59.2 59.3 125.9 120.5 12 13 14 15 16 17 18 19 20 21 22 23 24 25 26 27 28 14.6 16.1 11.4 18.4 5.6 5.5 16 Accounts Payable 17 Short-term Debt 18 Other Current Liabilities 19 Current Liabilities 20 Long-term Debt 21 Non Current Liabilities 22 Book Equity 23 Total Liabilities and Equity 38.6 9.0 33.0 10.4 15.6 13.0 62.7 64.1 125.9 120.5 Sales Growth Gross Margin (3/1) Operating Exp/Sales (4/1) Operating Margin (5/1) Interest Expense/Debt (6/(17+20)) Tax Rate (8/7) 0.096 47.996 35.096 14.296 2.896 26.496 7.6 Receivable Turnover (1/10) Accounts Receivable Days (10/1*365 days) Inventory Turnover (2/11) Inventory Days (1/2*365 days) Other Current Assets/Sales (12/1) PPE Turnover (1/13) Other Noncurrent Asset Turnover (1/14) Total Asset Turnover (1/15) Return on Assets (5*(1-0.35)/15) 48.2 5.5 63.7 10.396 2.8 1.6 0.8 7.196 Accounts Payable Days (16/2*365 days) Other Current Liabilities/Sales (18/1) Non Current Liabilities/Sales (21/1) 122.2 6.096 14.196 2014A 2012 89.9 47.5 424 29.0 13.4 0.7 12.7 91.9 47.6 44.3 33.4 10.9 0.6 3.3 10.3 3.4 6.9 9.4 13.5 9.2. 11.3 34.6 64.9 133.5 (1) Sales (2) Cost of sales (3) Gross profit (4) Operating expenses (5) Operating profit (6) Net Interest expense (7) Profit before taxes (8) Taxes (9) Profit after taxes (10) Accounts receivable (11) Inventory (12) Other current assets (13) Net property, plant, and equipment (14) Other non current assets (15) Total assets (16) Accounts payable (17) Short-term debt (18) Other current liabilities (19) Current liabilities (20) Long-term debt (21) Non current liabilities (22) Book equity (23) Total liabilities and equity Sales growth Gross margin (3/1) Operating exp/Sales (4/1) Operating margin (5/1) Interest expense/Debt (6/(17+20) Tax rate (8/7) Receivable turnover (1/10) Accounts receivable days (10/1-365 days) Inventory turnover (2/11) Inventory days (11/2'365 days) Other current assets/Sales (12/1) PPE turnover (1/13) Other noncurrent asset turnover (1/14) Total asset turnover (1/15) Return on assets (5*(1-35)/15) Accounts payable days (16/2*365 days) Other curr llab/Sales (18/1) Non curr lab/Sales (21/1) 13.1 8.9 12.0 32.7 59.2 125.9 14.6 18.4 5.6 38.6 9.0 15.6 62.7 125.9 7.4% 47.2% 32.3% 14.9% 2.6% 25.7% 6.9 53.0 5.3 68.7 13.4% 2.8 2013 92.4 48.1 44.3 31.2 13.1 0.6 12.4 3.3 9.2 12.2 8.4 9.5 31.0 59.3 120.5 16.1 11.4 5.5 32.9 10.4 13.0 64.1 120.5 2.7% 47.9% 33.8% 14.1% 2.9% 26.2% 7.6 48.2 5.7 63.6 10.3% 3.0 1.6 0.8 7.1% 121.9 17.4 8.8 6.7 32.9 12.4 16.3 71.9 133.5 -0.6% 48.2% 36.4% 11.9% 3.0% 32.8% 6.8 53.5 5.2 70.4 12.3% 2.7 1.4 0.7 5.3% 1.5 0.7 6.9% 112.4 6.2% 17.4% 5.9% 133.9 7.2% 17.7% 14.1%
Step by Step Solution
There are 3 Steps involved in it

Get step-by-step solutions from verified subject matter experts