

As you complete more years of education, you can count on a greater income. The bar graph
Fantastic news! We've Found the answer you've been seeking!
Question:
As you complete more years of education, you can count on a greater income. The bar graph shows the median, or middlemost, annual income for Americans, by level of education, for a recent year.
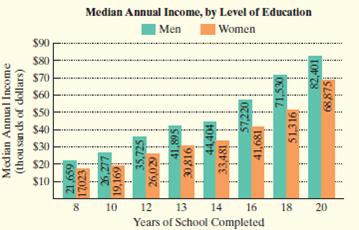
Here are polynomial models that describe the median annual income for men, M, and for women, W, who have completed x years of education:
M = 177x2 + 288x + 7075
W = 255x2 − 2956x + 24,336
M = −18x3 + 923x2 − 9603x + 48,446
W = 17x3 − 450x2 + 6392x − 14,764.
Exercise are based on these models and the data displayed by the graph.
a. Use the equations defined by polynomials of degree 3 to find a mathematical model for M − W.
b. According to the model in part (a), what is the difference in the median annual income between men and women with 14 years of education?c. According to the data displayed by the graph, what is the actual difference in the median annual income between men and women with 14 years of education? Did the model in part (b) underestimate or overestimate this difference? By how much?Expert Answer:
Step 1 of 7 A Below is a chart showing median annual income for group M versus group W by ... View the full answer

Related Book For 
Elementary Statistics A Step By Step Approach
ISBN: 978-1259755330
10th edition
Authors: Allan G. Bluman
Posted Date:
