

Question: Here are the things that are required in this project. 1.Analyze the sale price data using descriptive statistics, frequency distribution, and other tools (no need
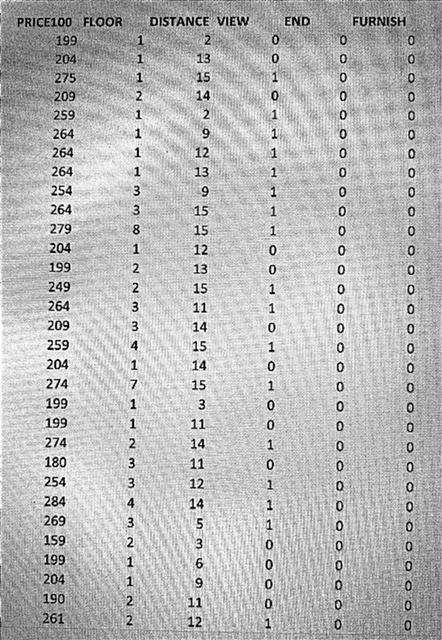
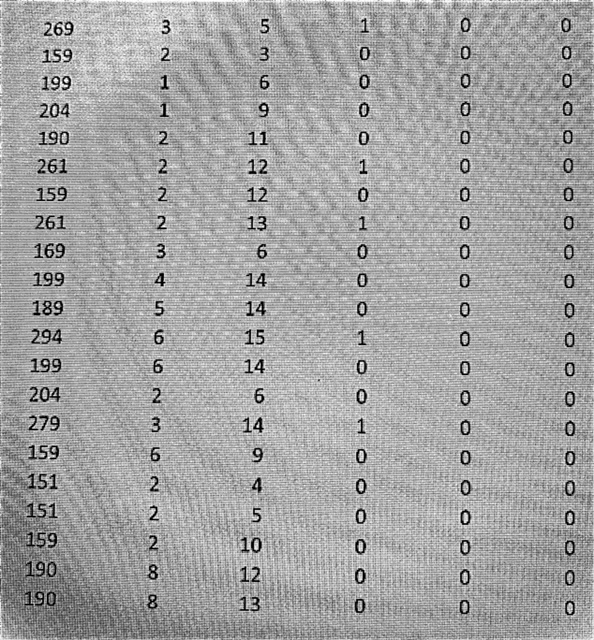
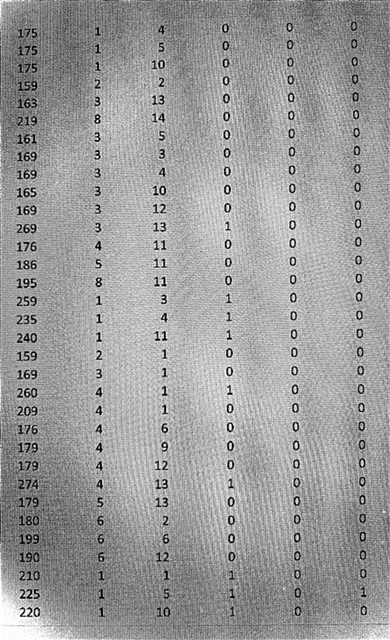
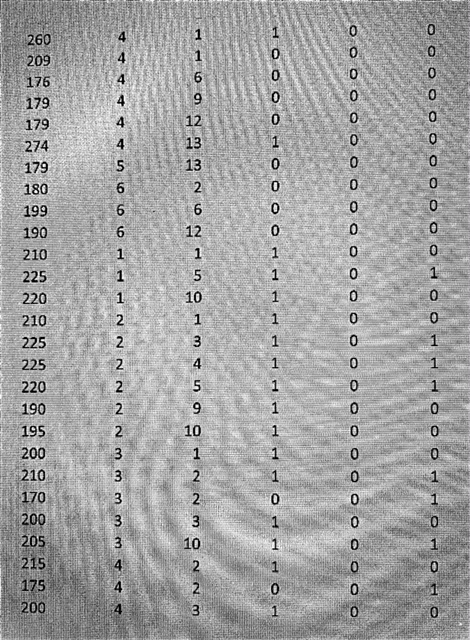
Here are the things that are required in this project. 1.Analyze the sale price data using descriptive statistics, frequency distribution, and other tools (no need to compare sale price based on other variables which you will be doing in question 2. In this question look only at sale price). Use charts and figures to present and aid your analysis. Which measure of central tendency would you use? (1-2 parags) 2.Analyze what factors influence the sale price. Use any of the methods (including figures and tables) discussed in the course to answer this question. (Do not use regression which is specifically asked in question 3. Hint: Use Pivot tables to slice and dice based on multiple factors, create bar charts based on different factors, etc. Summarize your observations.). (1-2 paras) 3.Build a (multi variable) regression model that predicts the sale price of an apartment unit. Present the regression output in your report. 4.Prep a professional summary report (2-3 paras) that presents the results of your regression analysis. Be sure to interpret some of the coefficients. What are some conclusions and implications for an interested buyer? (Present details regarding what the regression output means at a managerial level. Present this in a non-technical way i.e., should be comprehended by a person who has not taken MGMT 350). 5.Prep a technical summary of your regression analysis (2-3 parags), including any limitations in your analysis. Technical summary should include details regarding p-value, R-square and other technical aspects of a regression.
Step by Step Solution
There are 3 Steps involved in it

Get step-by-step solutions from verified subject matter experts