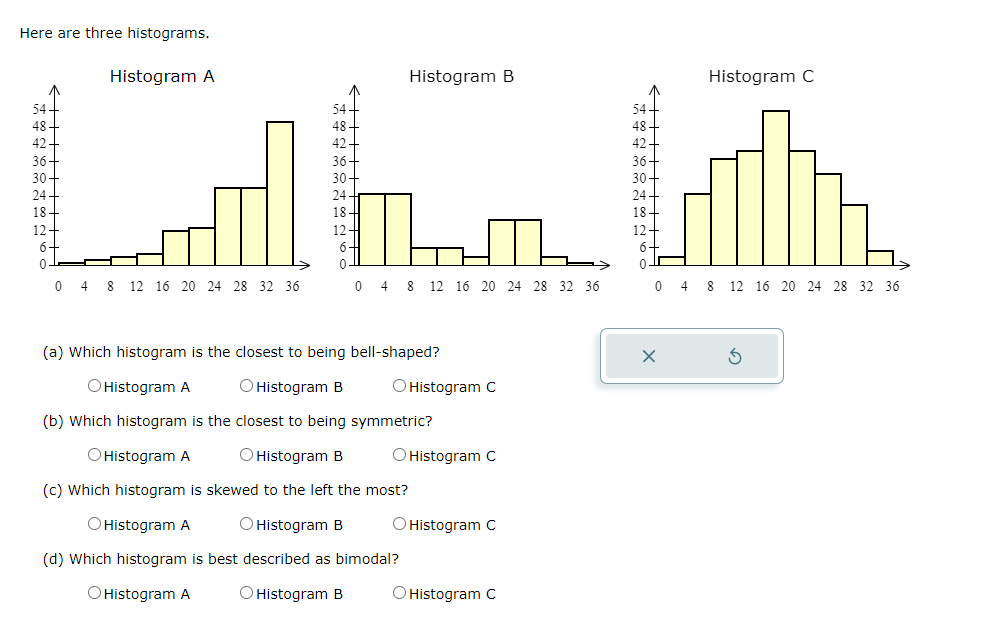
Question: Here are three histograms. Histogram A Histogram B Histogram C 54+ 54+ 54+ 48+ 48 - 48+ 42 + 42- 42 - 36+ 36+ 36+

Here are three histograms. Histogram A HistogramHere are three histograms. Histogram A Histogram
Here are three histograms. Histogram A Histogram B Histogram C 54+ 54+ 54+ 48+ 48 - 48+ 42 + 42- 42 - 36+ 36+ 36+ 30+ 30+ 30+ 24+ 24+ 18 18+ 18- 12+ 12 + 12 - 6- TO 0 4 8 12 16 20 24 28 32 36 0 4 8 12 16 20 24 28 32 36 0 4 8 12 16 20 24 28 32 36 (a) Which histogram is the closest to being bell-shaped? X 5 O Histogram A O Histogram B O Histogram C (b) Which histogram is the closest to being symmetric? O Histogram A O Histogram B O Histogram C (c) Which histogram is skewed to the left the most? O Histogram A O Histogram B O Histogram C (d) Which histogram is best described as bimodal? O Histogram A O Histogram B O Histogram CHere are the hottest recorded temperatures (in F) for each of eighteen cities throughout Narth America. L=l et gt (in F) 111 105 117 95 114 108 116 99 112 103 96 102 101 106 108 97 118 115 (a) Complete the grouped frequency distribution for the data. (Note that the class width is 6.) LI ] T s F (in F) L 1 T 94.5-100.5 100.5-106.5 106.5-112.5 112.5-118.5 (b} Construct a histogram for the data. Frequency M 945 100.5 106.5 1125 1185 Temperatures (in F)

Step by Step Solution

There are 3 Steps involved in it

1 Expert Approved Answer
Step: 1 Unlock blur-text-image
Question Has Been Solved by an Expert!

Get step-by-step solutions from verified subject matter experts

Step: 2 Unlock
Step: 3 Unlock

Students Have Also Explored These Related Mathematics Questions!