

Question: Here is a bivariate data set. X y -1.7 -65.4 67.5 173.8 46.5 107.4 12.6 88.4 23.9 80.1 -4.7 87 -9.4 -35.2 47.3 105.9
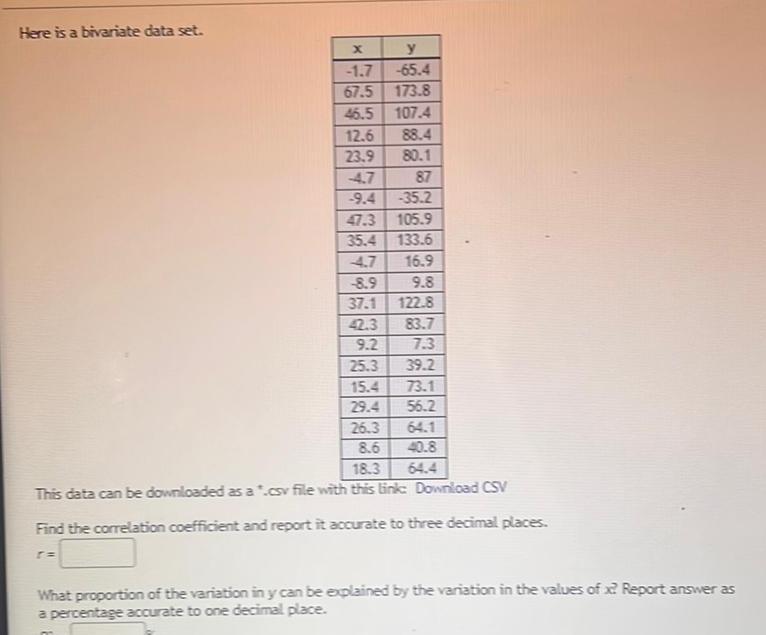
Here is a bivariate data set. X y -1.7 -65.4 67.5 173.8 46.5 107.4 12.6 88.4 23.9 80.1 -4.7 87 -9.4 -35.2 47.3 105.9 35.4 133.6 4.7 16.9 -8.9 9.8 37.1 122.8 42.3 83.7 9.2 7.3 25.3 39.2 15.4 73.1 29.4 56.2 26.3 64.1 8.6 40.8 18.3 64.4 This data can be downloaded as a ".csv file with this link: Download CSV Find the correlation coefficient and report it accurate to three decimal places. [= What proportion of the variation in y can be explained by the variation in the values of x? Report answer as a percentage accurate to one decimal place.
Step by Step Solution
There are 3 Steps involved in it
1 Expert Approved Answer
Step: 1 Unlock

Question Has Been Solved by an Expert!
Get step-by-step solutions from verified subject matter experts
Step: 2 Unlock
Step: 3 Unlock