

Question: Here is a bivariate data set. X y 44.1 47.7 53 90.5 47.9 -87.7 41.8 92.5 46.7 -53.6 81.2 29.7 34.4 30.5 62.7 205.2 31.1
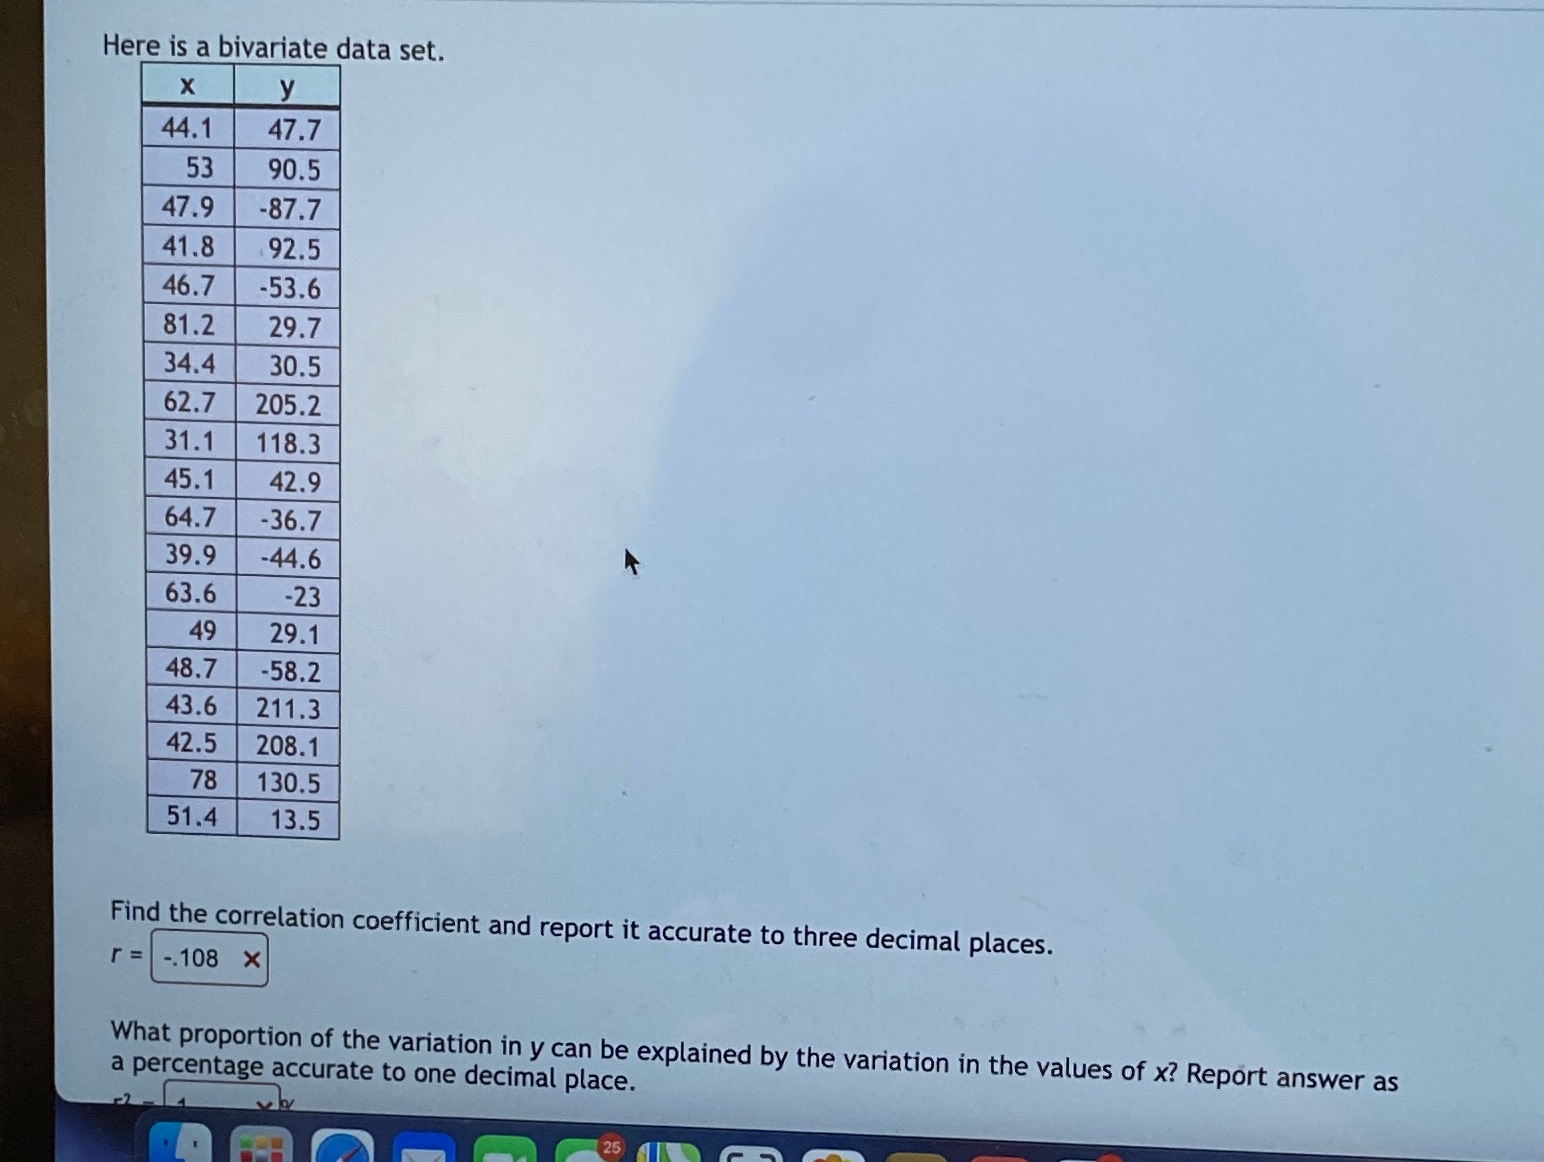
Here is a bivariate data set. X y 44.1 47.7 53 90.5 47.9 -87.7 41.8 92.5 46.7 -53.6 81.2 29.7 34.4 30.5 62.7 205.2 31.1 118.3 45.1 42.9 64.7 -36.7 39.9 -44.6 K 63.6 -23 49 29.1 48.7 -58.2 43.6 211.3 42.5 208.1 78 130.5 51.4 13.5 Find the correlation coefficient and report it accurate to three decimal places. r = -.108 x What proportion of the variation in y can be explained by the variation in the values of x? Report answer as a percentage accurate to one decimal place. 25
Step by Step Solution
There are 3 Steps involved in it
1 Expert Approved Answer
Step: 1 Unlock

Question Has Been Solved by an Expert!
Get step-by-step solutions from verified subject matter experts
Step: 2 Unlock
Step: 3 Unlock