

Question: Here is a bivariate data set. X y 44.8 58.8 52.3 64.4 31.4 58.6 61.9 77 34.4 72.7 61.1 79.2 36.6 54.4 41.2 73.3 19.9
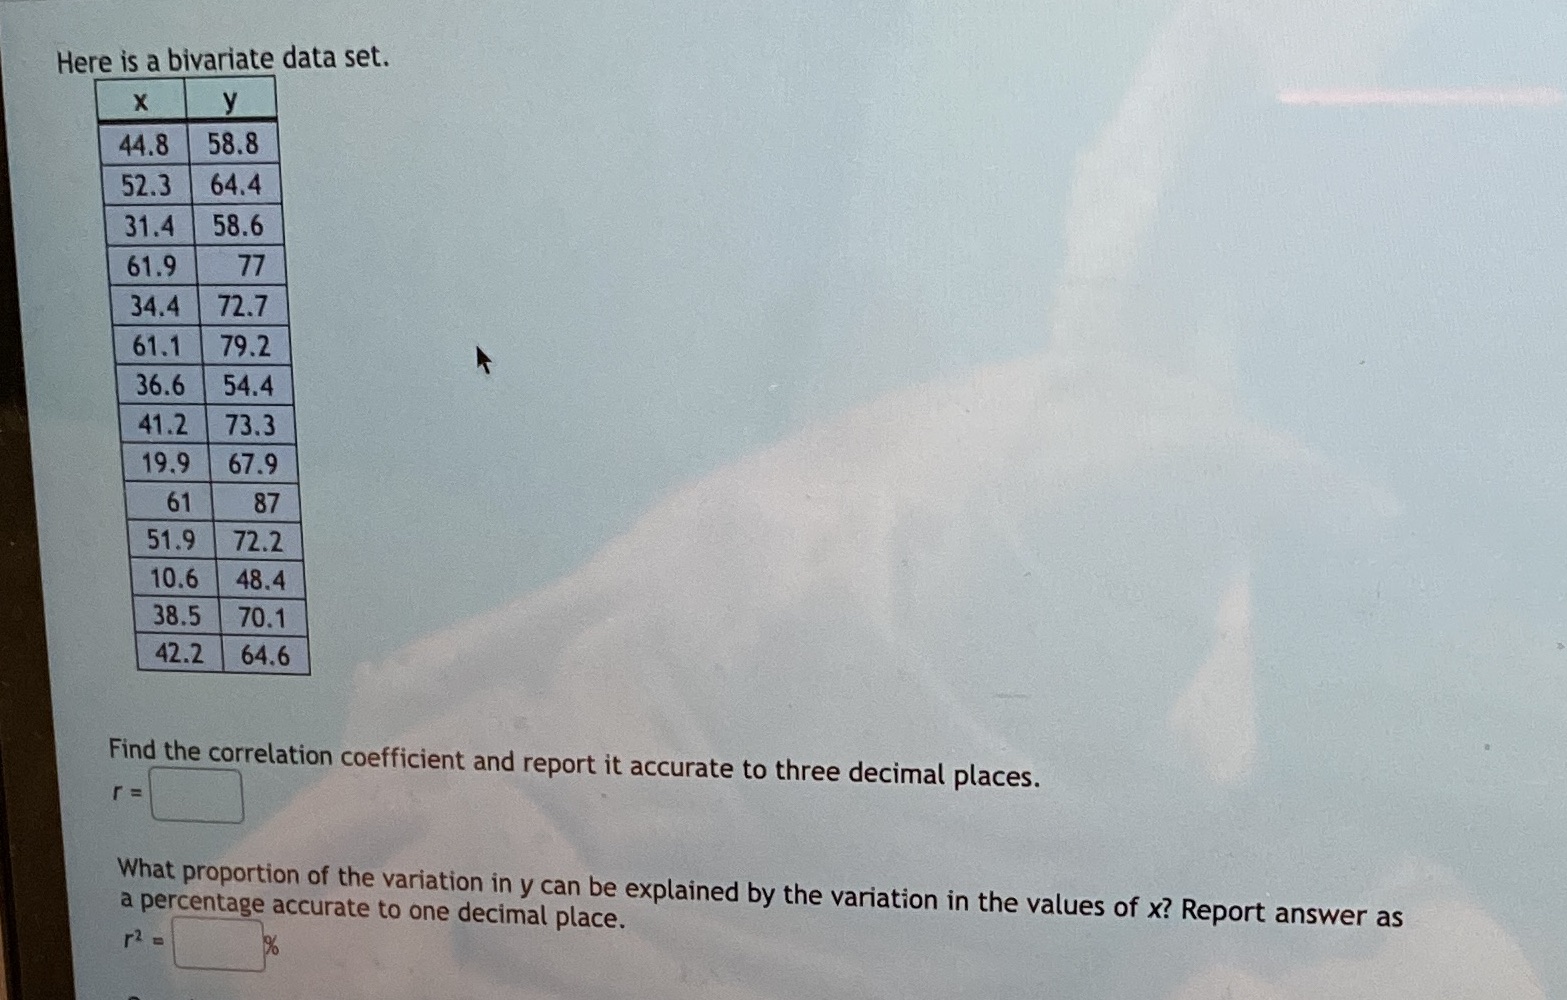
Here is a bivariate data set. X y 44.8 58.8 52.3 64.4 31.4 58.6 61.9 77 34.4 72.7 61.1 79.2 36.6 54.4 41.2 73.3 19.9 67.9 61 87 51.9 72.2 10.6 48.4 38.5 70.1 42.2 64.6 Find the correlation coefficient and report it accurate to three decimal places. r = What proportion of the variation in y can be explained by the variation in the values of x? Report answer as a percentage accurate to one decimal place. 12 =
Step by Step Solution
There are 3 Steps involved in it
1 Expert Approved Answer
Step: 1 Unlock

Question Has Been Solved by an Expert!
Get step-by-step solutions from verified subject matter experts
Step: 2 Unlock
Step: 3 Unlock