

Question: Here is a chart which represents two different companies, A and B . The market benchmark is line C . The 1 4 In the
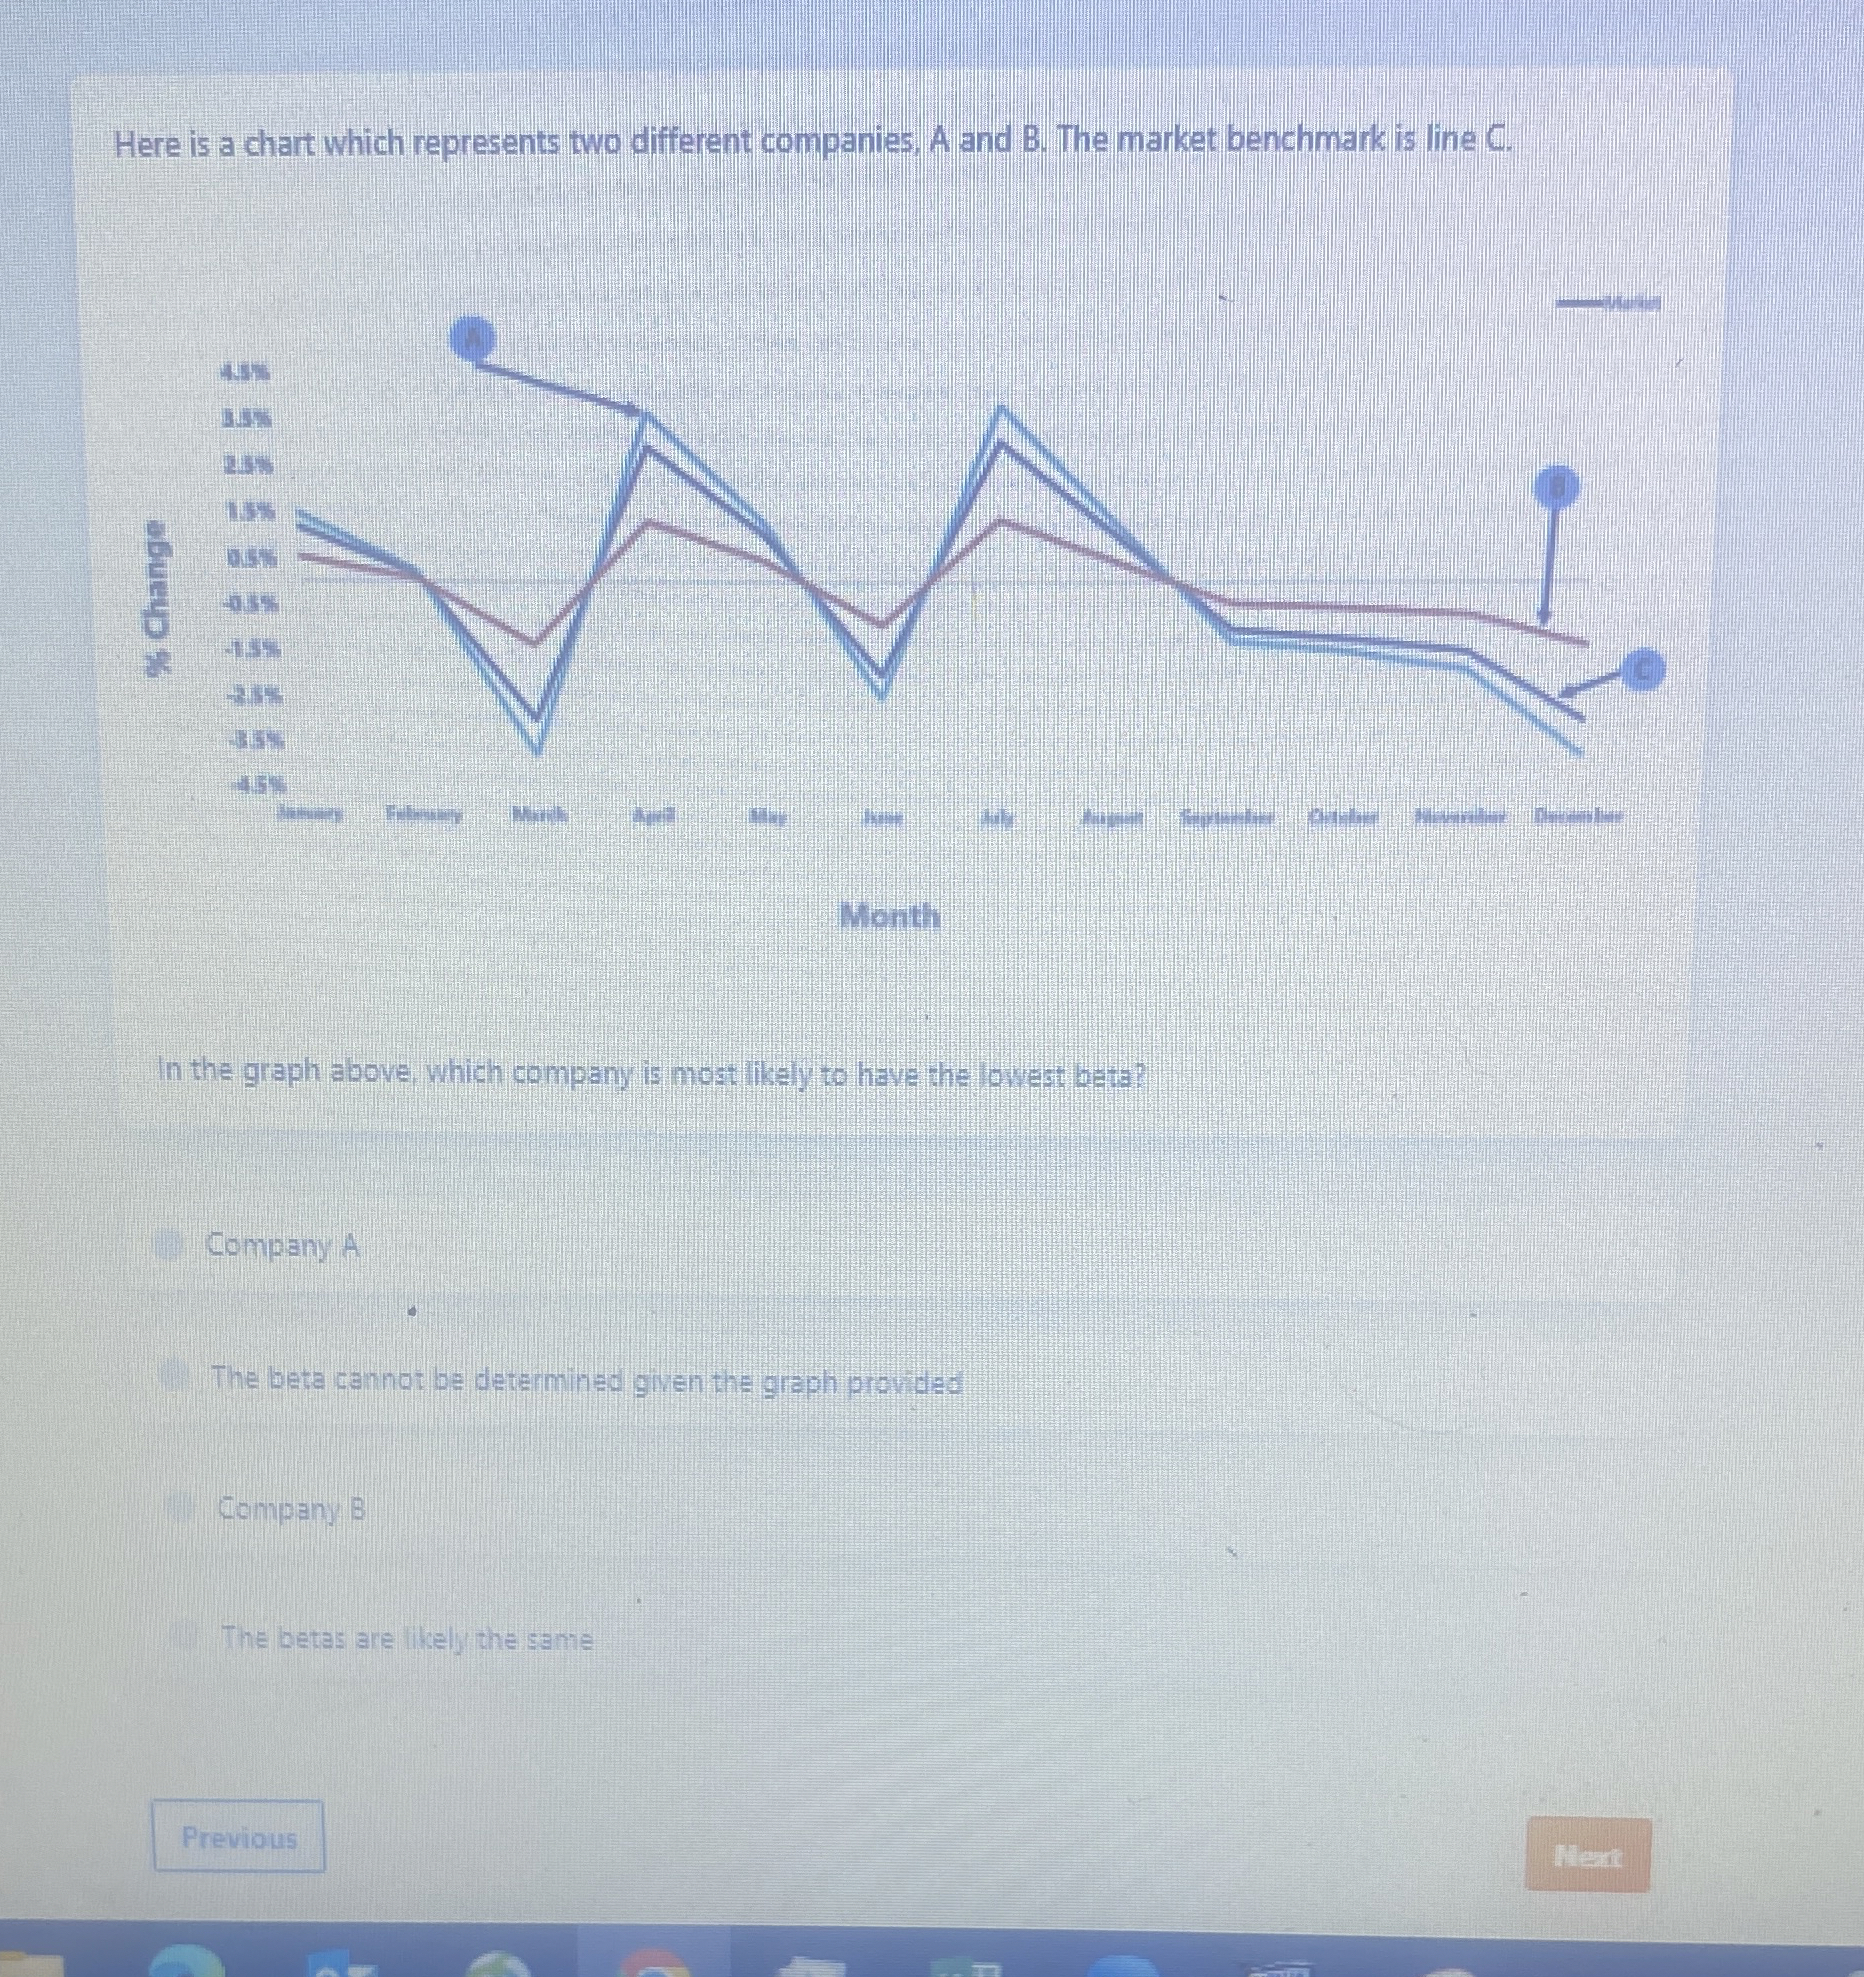
Here is a chart which represents two different companies, A and The market benchmark is line C
The
In the graph above, which company is moat likely to have the lowett beta?
Company A
and
beta cannot be determined given the graph provided
Company B
The betas are likely the same
Step by Step Solution
There are 3 Steps involved in it
1 Expert Approved Answer
Step: 1 Unlock

Question Has Been Solved by an Expert!
Get step-by-step solutions from verified subject matter experts
Step: 2 Unlock
Step: 3 Unlock