

Question: Here is a data set (n = 100) that has been sorted. 5 6 7 8 9 10 17.7 18.7 19.7 20.3 20.9 21.8
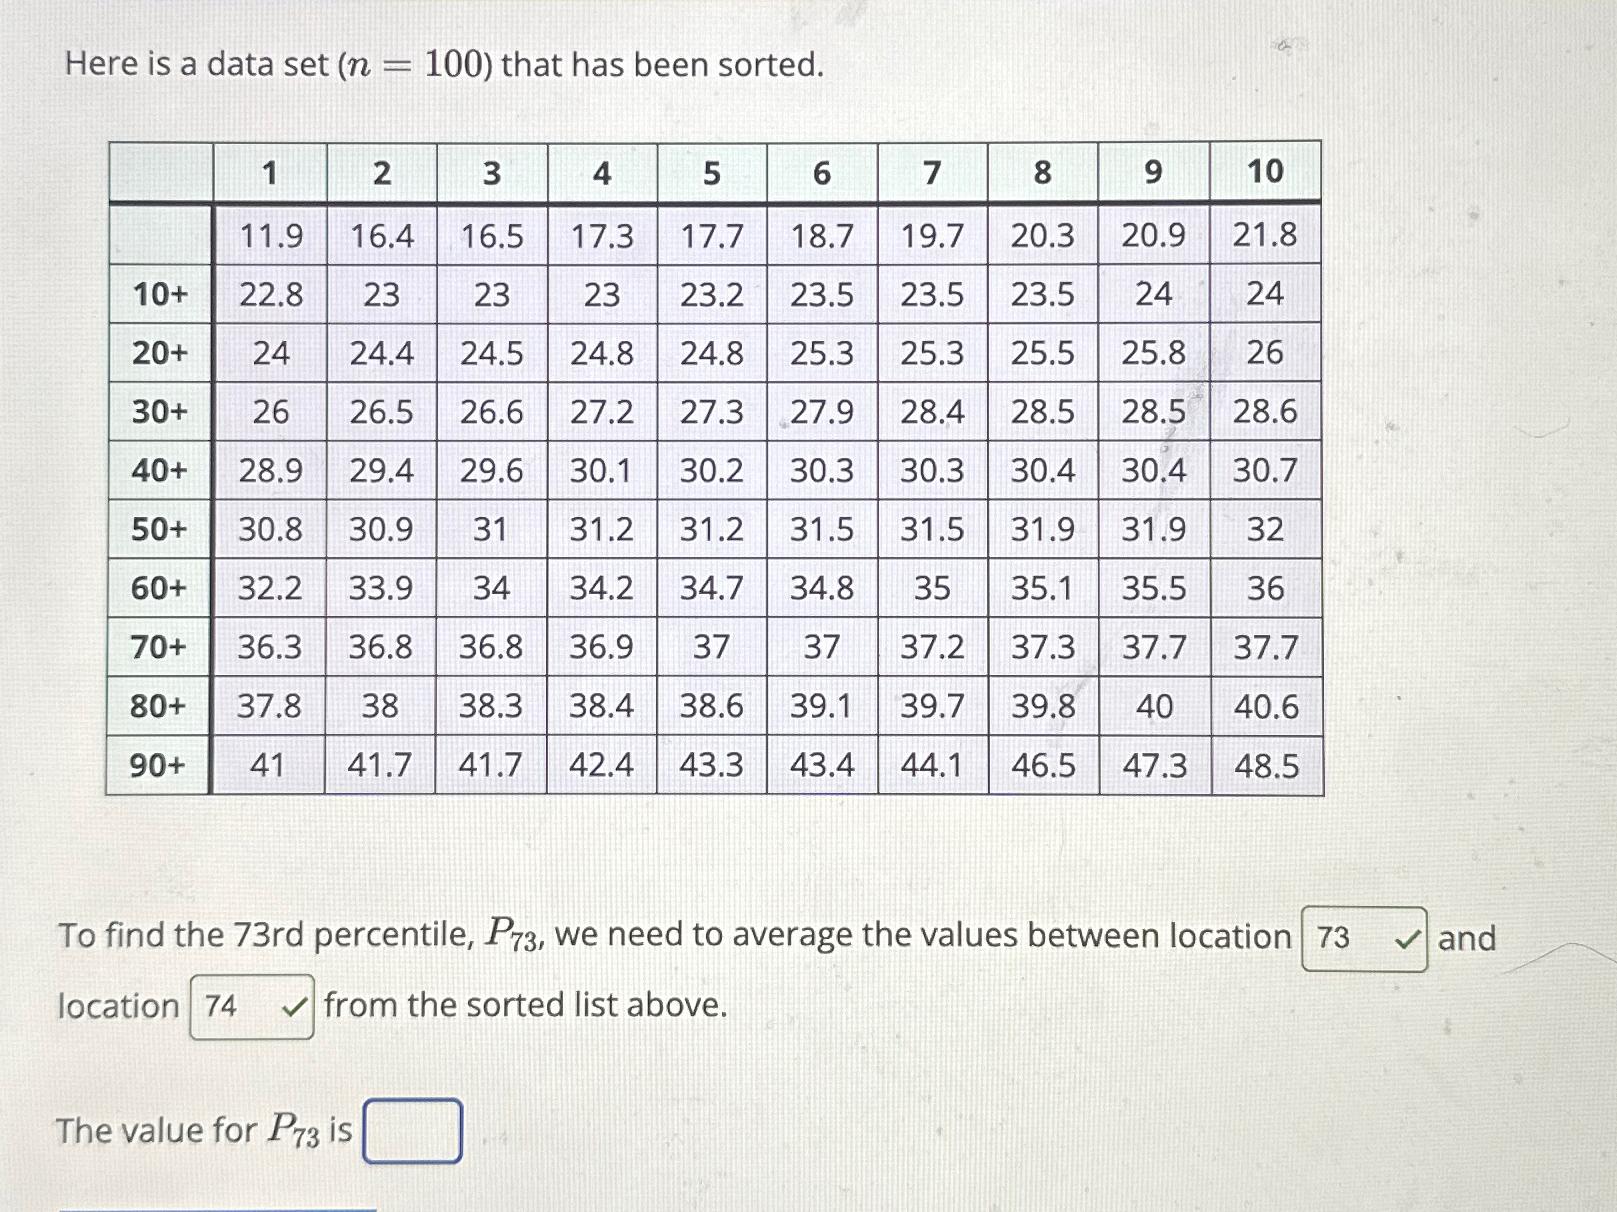
Here is a data set (n = 100) that has been sorted. 5 6 7 8 9 10 17.7 18.7 19.7 20.3 20.9 21.8 23.2 23.5 23.5 23.5 24 24 24.8 25.3 25.3 25.5 25.8 26 28.4 28.5 28.5 28.6 30.3 30.3 30.4 30.4 30.7 31.5 31.5 31.9 31.9 32 34.8 35 35.1 35.5 36 37 37.2 37.3 37.7 37.7 37.8 38 38.3 38.4 38.6 39.1 39.7 39.8 40 40.6 41 41.7 41.7 42.4 43.3 43.4 44.1 46.5 47.3 48.5 1 2 3 4 11.9 16.4 16.5 17.3 10+ 22.8 23 23 23 20+ 24 24.4 24.5 24.8 30+ 26 26.5 26.6 27.2 27.3 27.9 30.1 30.2 40+ 28.9 29.4 29.6 50+ 30.8 30.9 31 31.2 31.2 60+ 32.2 33.9 34 34.2 34.7 70+ 36.3 36.8 36.8 36.9 37 80+ 90+ To find the 73rd percentile, P73, we need to average the values between location 73 location 74 from the sorted list above. The value for P73 is and
Step by Step Solution
There are 3 Steps involved in it
The image shows a dataset of 100 sorted values in a 10x10 grid and there is an instruction to find t... View full answer

Get step-by-step solutions from verified subject matter experts