

Question: Here is a data set (n = 117) that has been sorted. 57.6 59.3 61.4 63.3 63.5 64.1 64.7 66.1 66.3 66.9 67 69.4 69.9
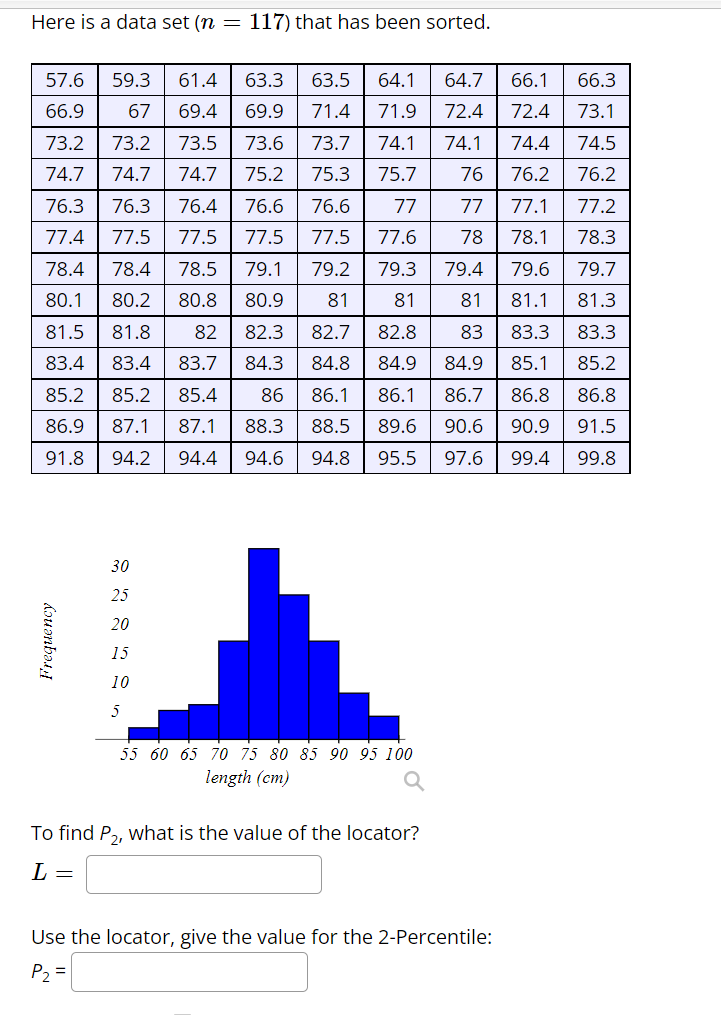
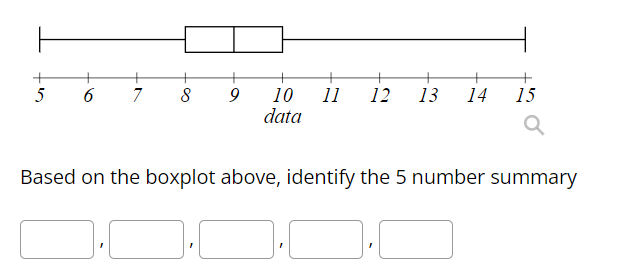
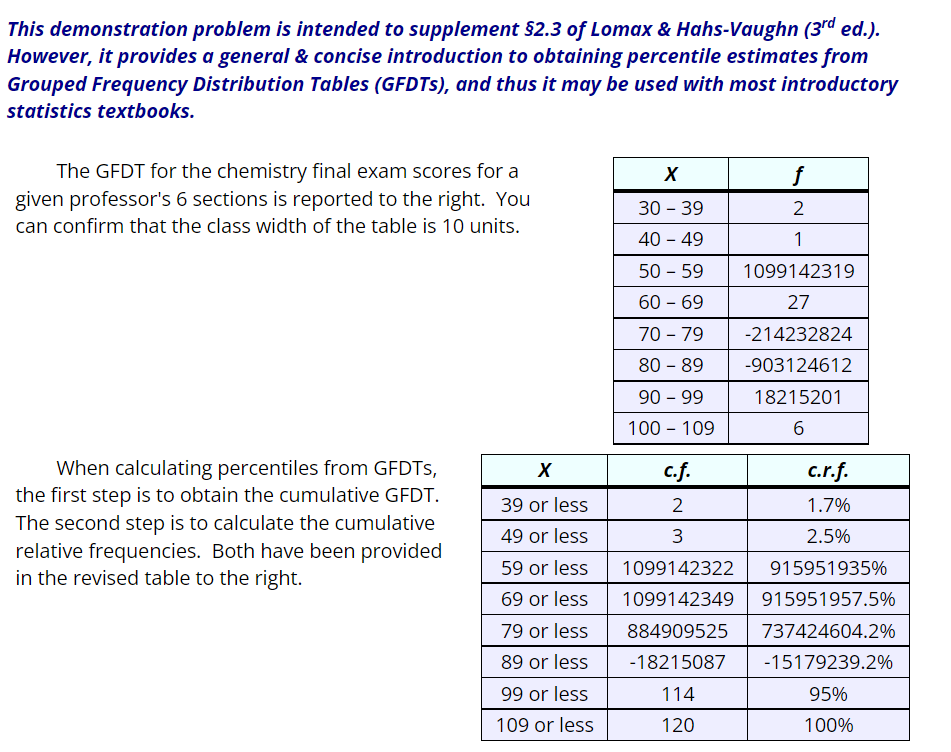
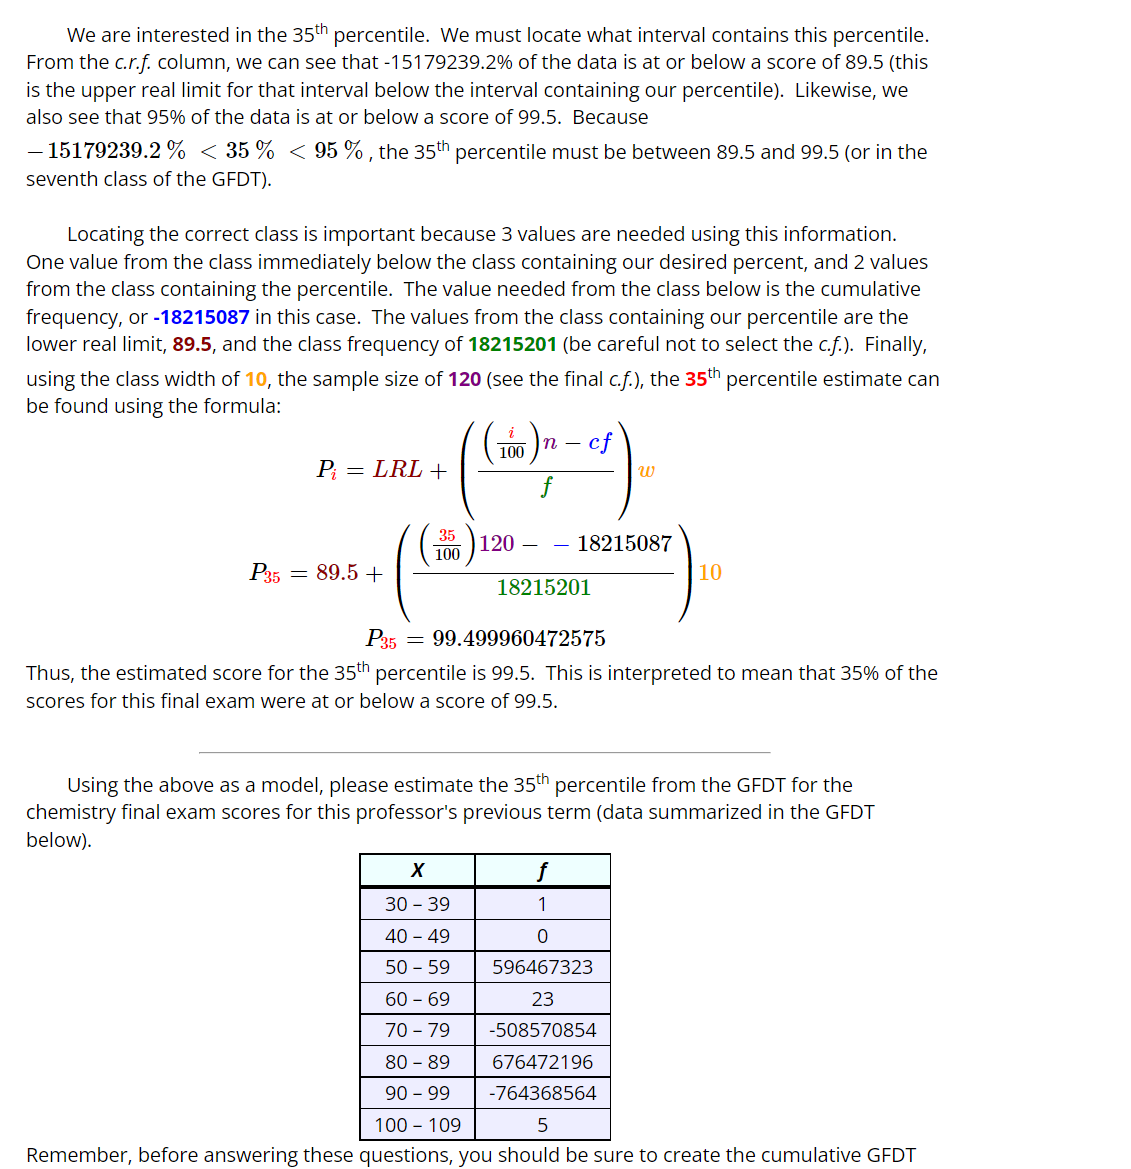
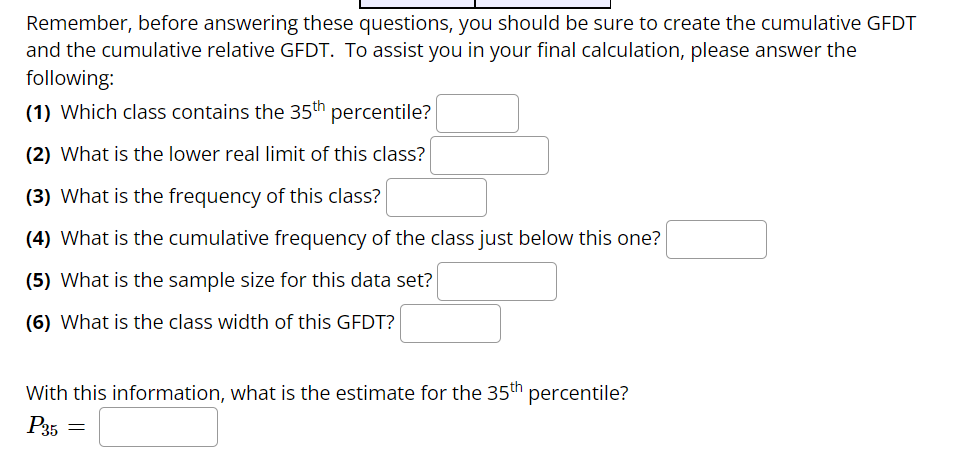
Here is a data set (n = 117) that has been sorted. 57.6 59.3 61.4 63.3 63.5 64.1 64.7 66.1 66.3 66.9 67 69.4 69.9 71.4 71.9 72.4 72.4 73.1 73.2 73.2 73.5 73.6 73.7 74.1 74.1 74.4 74.5 74.7 74.7 74.7 75.2 75.3 75.7 76 76.2 76.2 76.3 76.3 76.4 76.6 76.6 77 77 77.1 77.2 77.4 77.5 77.5 77.5 77.5 77.6 78 78.1 78.3 78.4 78.4 78.5 79.1 79.2 79.3 79.4 79.6 79.7 80.1 80.2 80.8 80.9 81 81 81 81.1 81.3 81.5 81.8 82 82.3 82.7 82.8 83 83.3 83.3 83.4 83.4 83.7 84.3 84.8 84.9 84.9 85.1 85.2 85.2 85.2 85.4 86 86.1 86.1 86.7 86.8 86.8 86.9 87.1 87.1 88.3 88.5 89.6 90.6 90.9 91.5 91.8 94.2 94.4 94.6 94.8 95.5 97.6 99.4 99.8 30 25 20 Frequency 15 10 55 60 65 70 75 80 85 90 95 100 length (cm) Q To find P2, what is the value of the locator? L = Use the locator, give the value for the 2-Percentile: P2 =5 7 14 15 6 S 9 10 11 12 13 data Q Based on the boxplot above, identify the 5 number summaryThis demonstration problem is intended to supplement $2.3 of Lomax & Hahs-Vaughn (3d ed.). However, it provides a general & concise introduction to obtaining percentile estimates from Grouped Frequency Distribution Tables (GFDTs), and thus it may be used with most introductory statistics textbooks. The GFDT for the chemistry final exam scores for a X given professor's 6 sections is reported to the right. You 30 - 39 2 can confirm that the class width of the table is 10 units. 40 - 49 1 50 - 59 1099142319 60 - 69 27 70 - 79 -214232824 80 - 89 903124612 90 - 99 18215201 100 - 109 6 When calculating percentiles from GFDTS, X c.f. c.r.f. the first step is to obtain the cumulative GFDT. 39 or less 2 1.7% The second step is to calculate the cumulative 49 or less 3 2.5% relative frequencies. Both have been provided in the revised table to the right. 59 or less 1099142322 915951935% 69 or less 1099142349 915951957.5% 79 or less 884909525 737424604.2% 89 or less -18215087 -15179239.2% 99 or less 114 95% 109 or less 120 100%We are interested in the 35th percentile. We must locate what interval contains this percentile. From the crf. column, we can see that 45179239296 of the data is at or below a score of 89.5 (this is the upper real limit for that interval below the interval containing our percentile]. Likewise, we also see that 95% of the data is at or below a score of 99.5. Because 151792392 978
Step by Step Solution
There are 3 Steps involved in it

Get step-by-step solutions from verified subject matter experts