

Question: Here is a link with the data necessary for answering this question: https://docs.google.com/spreadsheets/d/1sBMroeTeBqPWRw-l0VH8-1nsh3zsaJyDE0-cIwOXJ_k/edit?usp=sharing Part II [12 marks] a) [6 marks] Using the data in column
Here is a link with the data necessary for answering this question:
https://docs.google.com/spreadsheets/d/1sBMroeTeBqPWRw-l0VH8-1nsh3zsaJyDE0-cIwOXJ_k/edit?usp=sharing
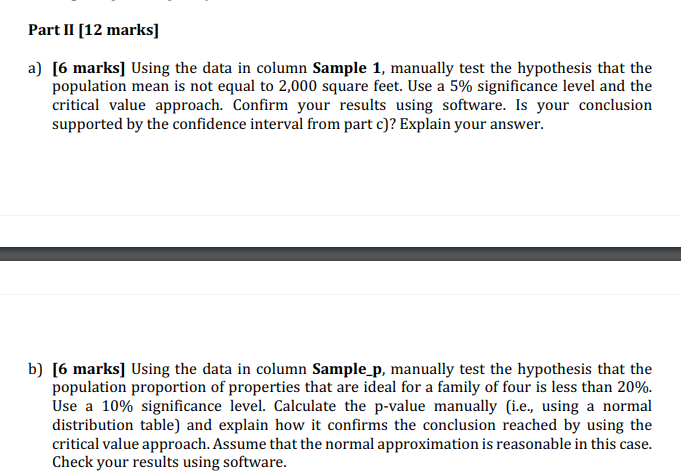
Part II [12 marks] a) [6 marks] Using the data in column Sample 1, manually test the hypothesis that the population mean is not equal to 2,000 square feet. Use a 5% significance level and the critical value approach. Confirm your results using software. Is your conclusion supported by the confidence interval from part c)? Explain your answer. b) [6 marks] Using the data in column Sample_p, manually test the hypothesis that the population proportion of properties that are ideal for a family of four is less than 20%. Use a 10% significance level. Calculate the p-value manually (i.e., using a normal distribution table) and explain how it confirms the conclusion reached by using the critical value approach. Assume that the normal approximation is reasonable in this case. Check your results using software
Step by Step Solution
There are 3 Steps involved in it

Get step-by-step solutions from verified subject matter experts