

Question: Here is a sample data set. 240.8 244.9 270 288.9 294.7 297 305.7 305.9 308.6 313.3 321.4 340 341.1 341.1 341.1 342.5 359.6 371.7 376

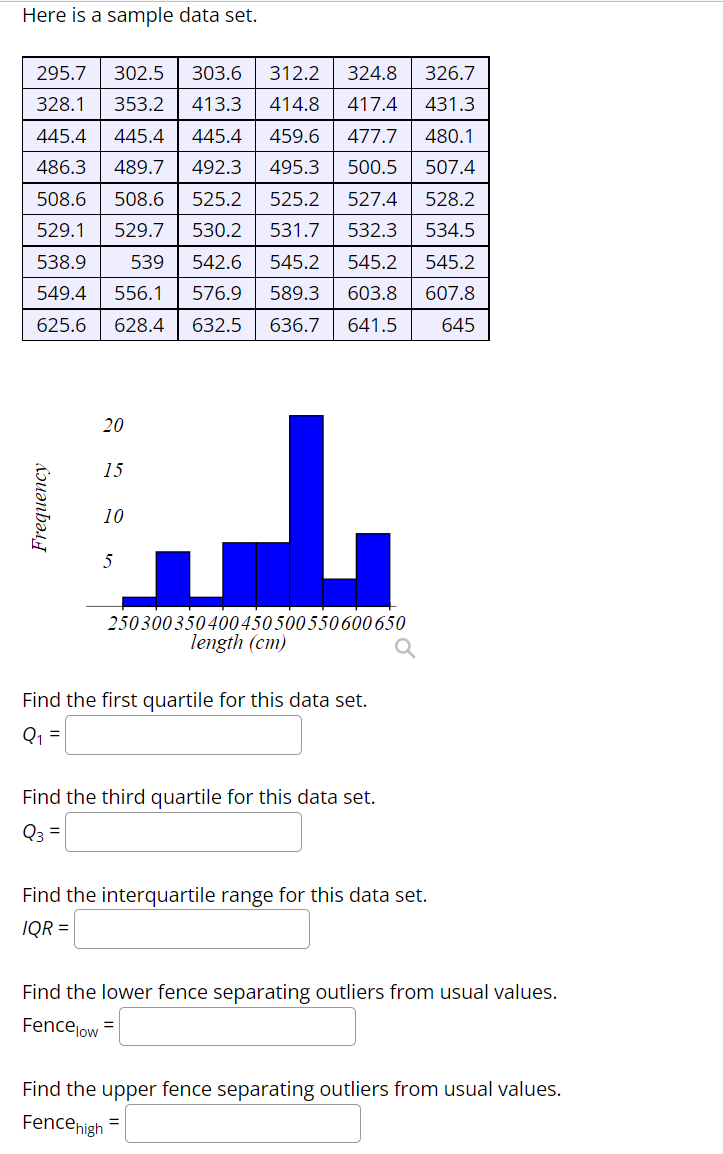

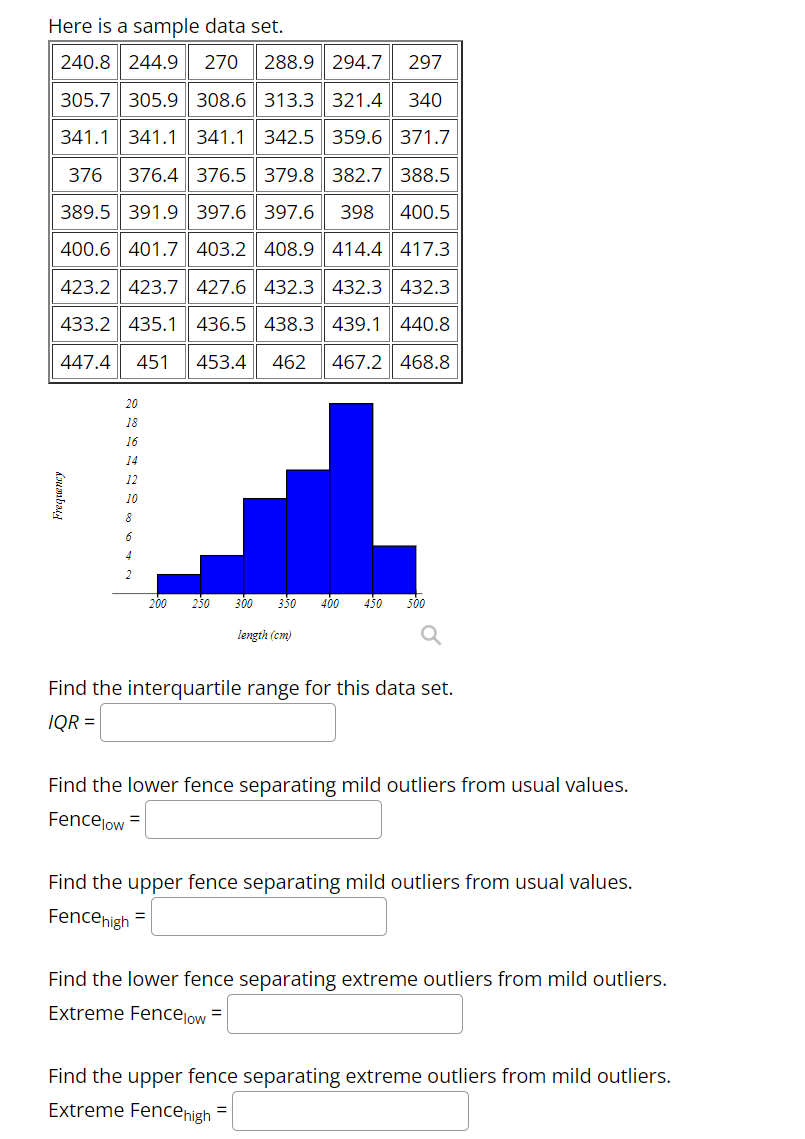

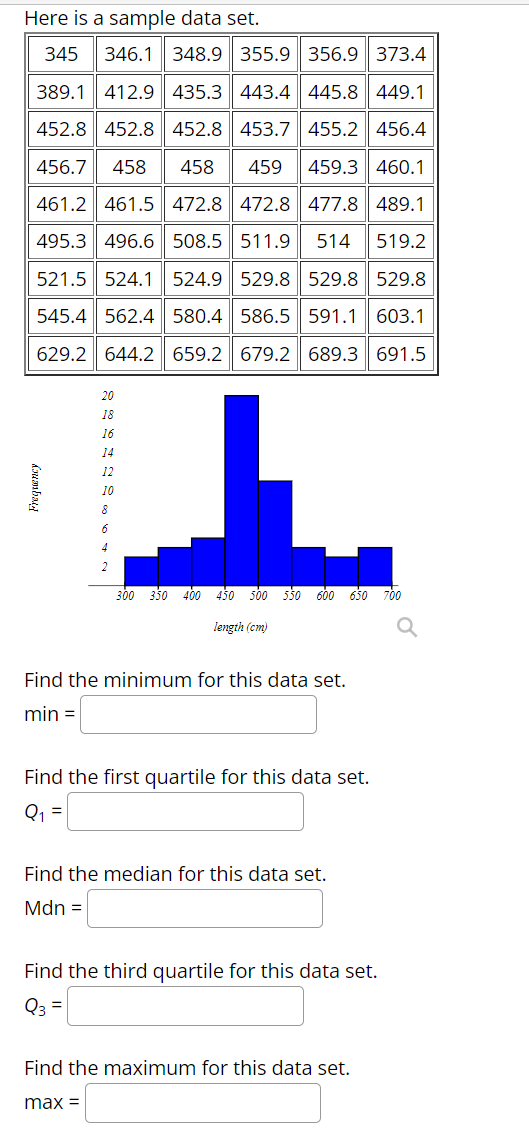
Here is a sample data set. 240.8 244.9 270 288.9 294.7 297 305.7 305.9 308.6 313.3 321.4 340 341.1 341.1 341.1 342.5 359.6 371.7 376 376.4 376.5 379.8 382.7 388.5 389.5 391.9 397.6 397.6 398 400.5 400.6 401.7 403.2 408.9 414.4 417.3 423.2 423.7 427.6 432.3 432.3 432.3 433.2 435.1 436.5 438.3 439.1 440.8 447.4 451 453.4 462 467.2 468.8 20 18 16 14 12 Frequency 10 200 250 300 350 400 450 500 length (cm) Q Find the interquartile range for this data set. IQR = Find the lower fence separating mild outliers from usual values. Fencelow = Find the upper fence separating mild outliers from usual values. Fencehigh = Find the lower fence separating extreme outliers from mild outliers. Extreme Fencelow Find the upper fence separating extreme outliers from mild outliers. Extreme Fencehigh =Here is a sample data set. 295.7 302.5 303.6 312.2 324.8 326.7 328.1 353.2 413.3 414.8 417.4 431.3 445.4 445.4 445.4 459.6 477.7 480.1 486.3 489.7 492.3 495.3 500.5 507.4 508.6 508.6 525.2 525.2 527.4 528.2 529.1 529.7 530.2 531.7 532.3 534.5 538.9 539 542.6 545.2 545.2 545.2 549.4 556.1 576.9 589.3 603.8 607.8 625.6 628.4 632.5 636.7 641.5 645 20 15 Frequency 10 250300350400 450500550600650 length (cm) Q Find the first quartile for this data set. Q1= Find the third quartile for this data set. Q3 = Find the interquartile range for this data set. IQR = Find the lower fence separating outliers from usual values. Fencelow = Find the upper fence separating outliers from usual values. Fencehigh =Here is a sample data set. 345 346.1 348.9 355.9 356.9 373.4 389.1 412.9 435.3 443.4 445.8 449.1 452.8 452.8 452.8 453.7 455.2 456.4 456.7 458 458 459 459.3 460.1 461.2 461.5 472.8 472.8 477.8 489.1 495.3 496.6 508.5 511.9 514 519.2 521.5 524.1 524.9 529.8 529.8 529.8 545.4 562.4 580.4 586.5 591.1 603.1 629.2 644.2 659.2 679.2 689.3 691.5 20 18 16 14 12 Frequency 10 300 350 400 450 500 350 600 650 700 length (cm) Q Find the minimum for this data set. min = Find the first quartile for this data set. Q1 = Find the median for this data set. Mdn = Find the third quartile for this data set. Q3 = Find the maximum for this data set. max =
Step by Step Solution
There are 3 Steps involved in it

Get step-by-step solutions from verified subject matter experts