

Question: Here is a sample data set. Frequency 300.4 354.2 312.6 320.7 359.7 388.5 322.1 335.6 351.2 396.5 398.5 403.1 418 418 418 425.8 426
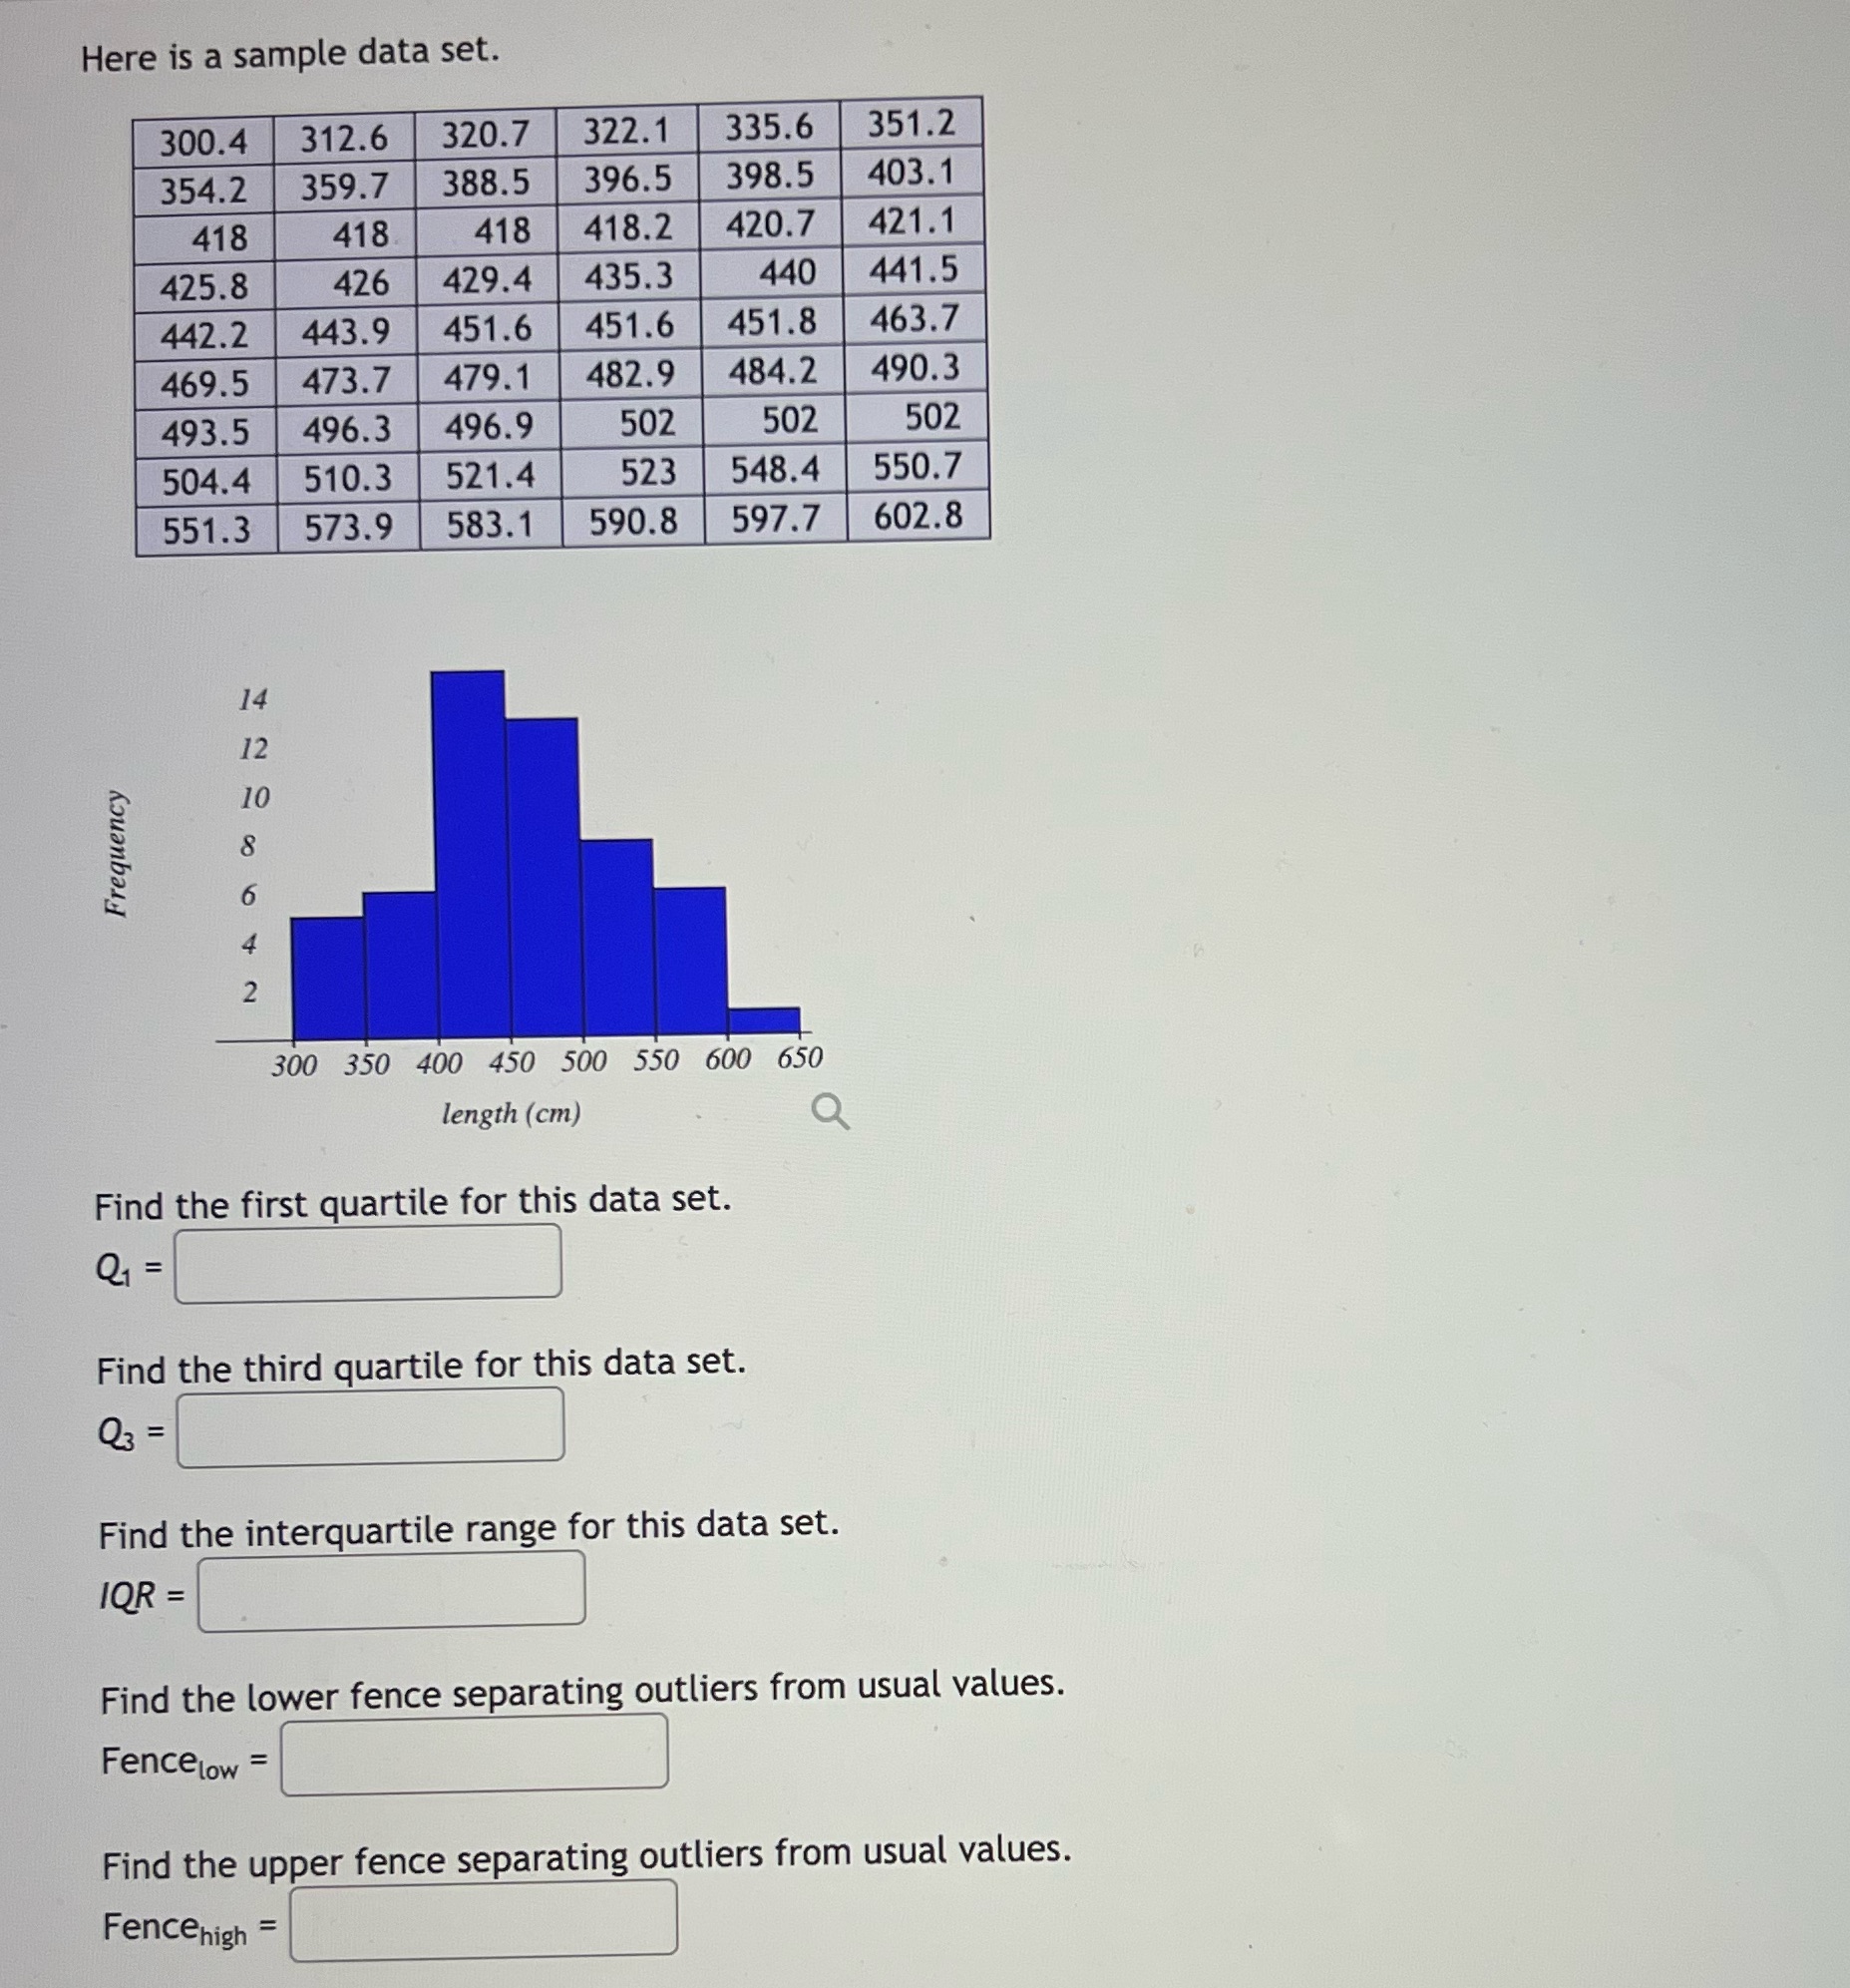
Here is a sample data set. Frequency 300.4 354.2 312.6 320.7 359.7 388.5 322.1 335.6 351.2 396.5 398.5 403.1 418 418 418 425.8 426 429.4 442.2 443.9 451.6 469.5 473.7 479.1 493.5 496.3 496.9 504.4 510.3 521.4 551.3 573.9 583.1 590.8 597.7 602.8 418.2 420.7 421.1 435.3 440 441.5 451.6 451.8 463.7 482.9 484.2 490.3 502 502 502 523 548.4 550.7 10 1228642 300 350 400 450 500 550 600 650 length (cm) Find the first quartile for this data set. Q = Find the third quartile for this data set. Q3 = Find the interquartile range for this data set. IQR = Find the lower fence separating outliers from usual values. Fence Low = Find the upper fence separating outliers from usual values. Fence high =
Step by Step Solution
There are 3 Steps involved in it
To find the first quartile Q for the given data set we need to arrange the data in ascending order 3... View full answer

Get step-by-step solutions from verified subject matter experts