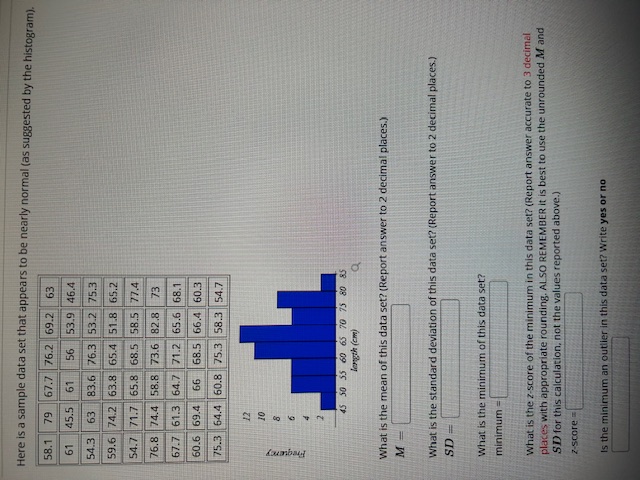
Question: Here is a sample data set that appears to be nearly normal (as suggested by the histogram). 58.1 79 67.7 76.2 69.2 63 61 45.5

Here is a sample data set that appears to be
Here is a sample data set that appears to be nearly normal (as suggested by the histogram). 58.1 79 67.7 76.2 69.2 63 61 45.5 61 56 53.9 46.4 54.3 63 83.6 76.3 53.2 75.3 59.6 74.2 63.8 65.4 51 8 65.2 54.7 71.7 65.8 68.5 58.5 77.4 76.8 74.4 58.8 73.6 82.8 73 67.7 61.3 64.7 71.2 65.6 68.1 60.6 69.4 G6 68.5 66.4 60.3 75.3 64.4 60.8 75.3 58.3 54.7 12 45 50 35 60 65 70 75 80 85 length (cm) a What is the mean of this data set? (Report answer to 2 decimal places.) M - What is the standard deviation of this data set? (Report answer to 2 decimal places.) SD = what is the minimum of this data set? minimum = what is the z-score of the minimum in this data set? (Report answer accurate to 3 decimal places with appropriate rounding. ALSO REMEMBER it is best to use the unrounded M and SD for this calculation, not the values reported above.) z-score = Is the minimum an outlier in this data set? Write yes or no

Step by Step Solution

There are 3 Steps involved in it

1 Expert Approved Answer
Step: 1 Unlock blur-text-image
Question Has Been Solved by an Expert!

Get step-by-step solutions from verified subject matter experts

Step: 2 Unlock
Step: 3 Unlock

Students Have Also Explored These Related Mathematics Questions!