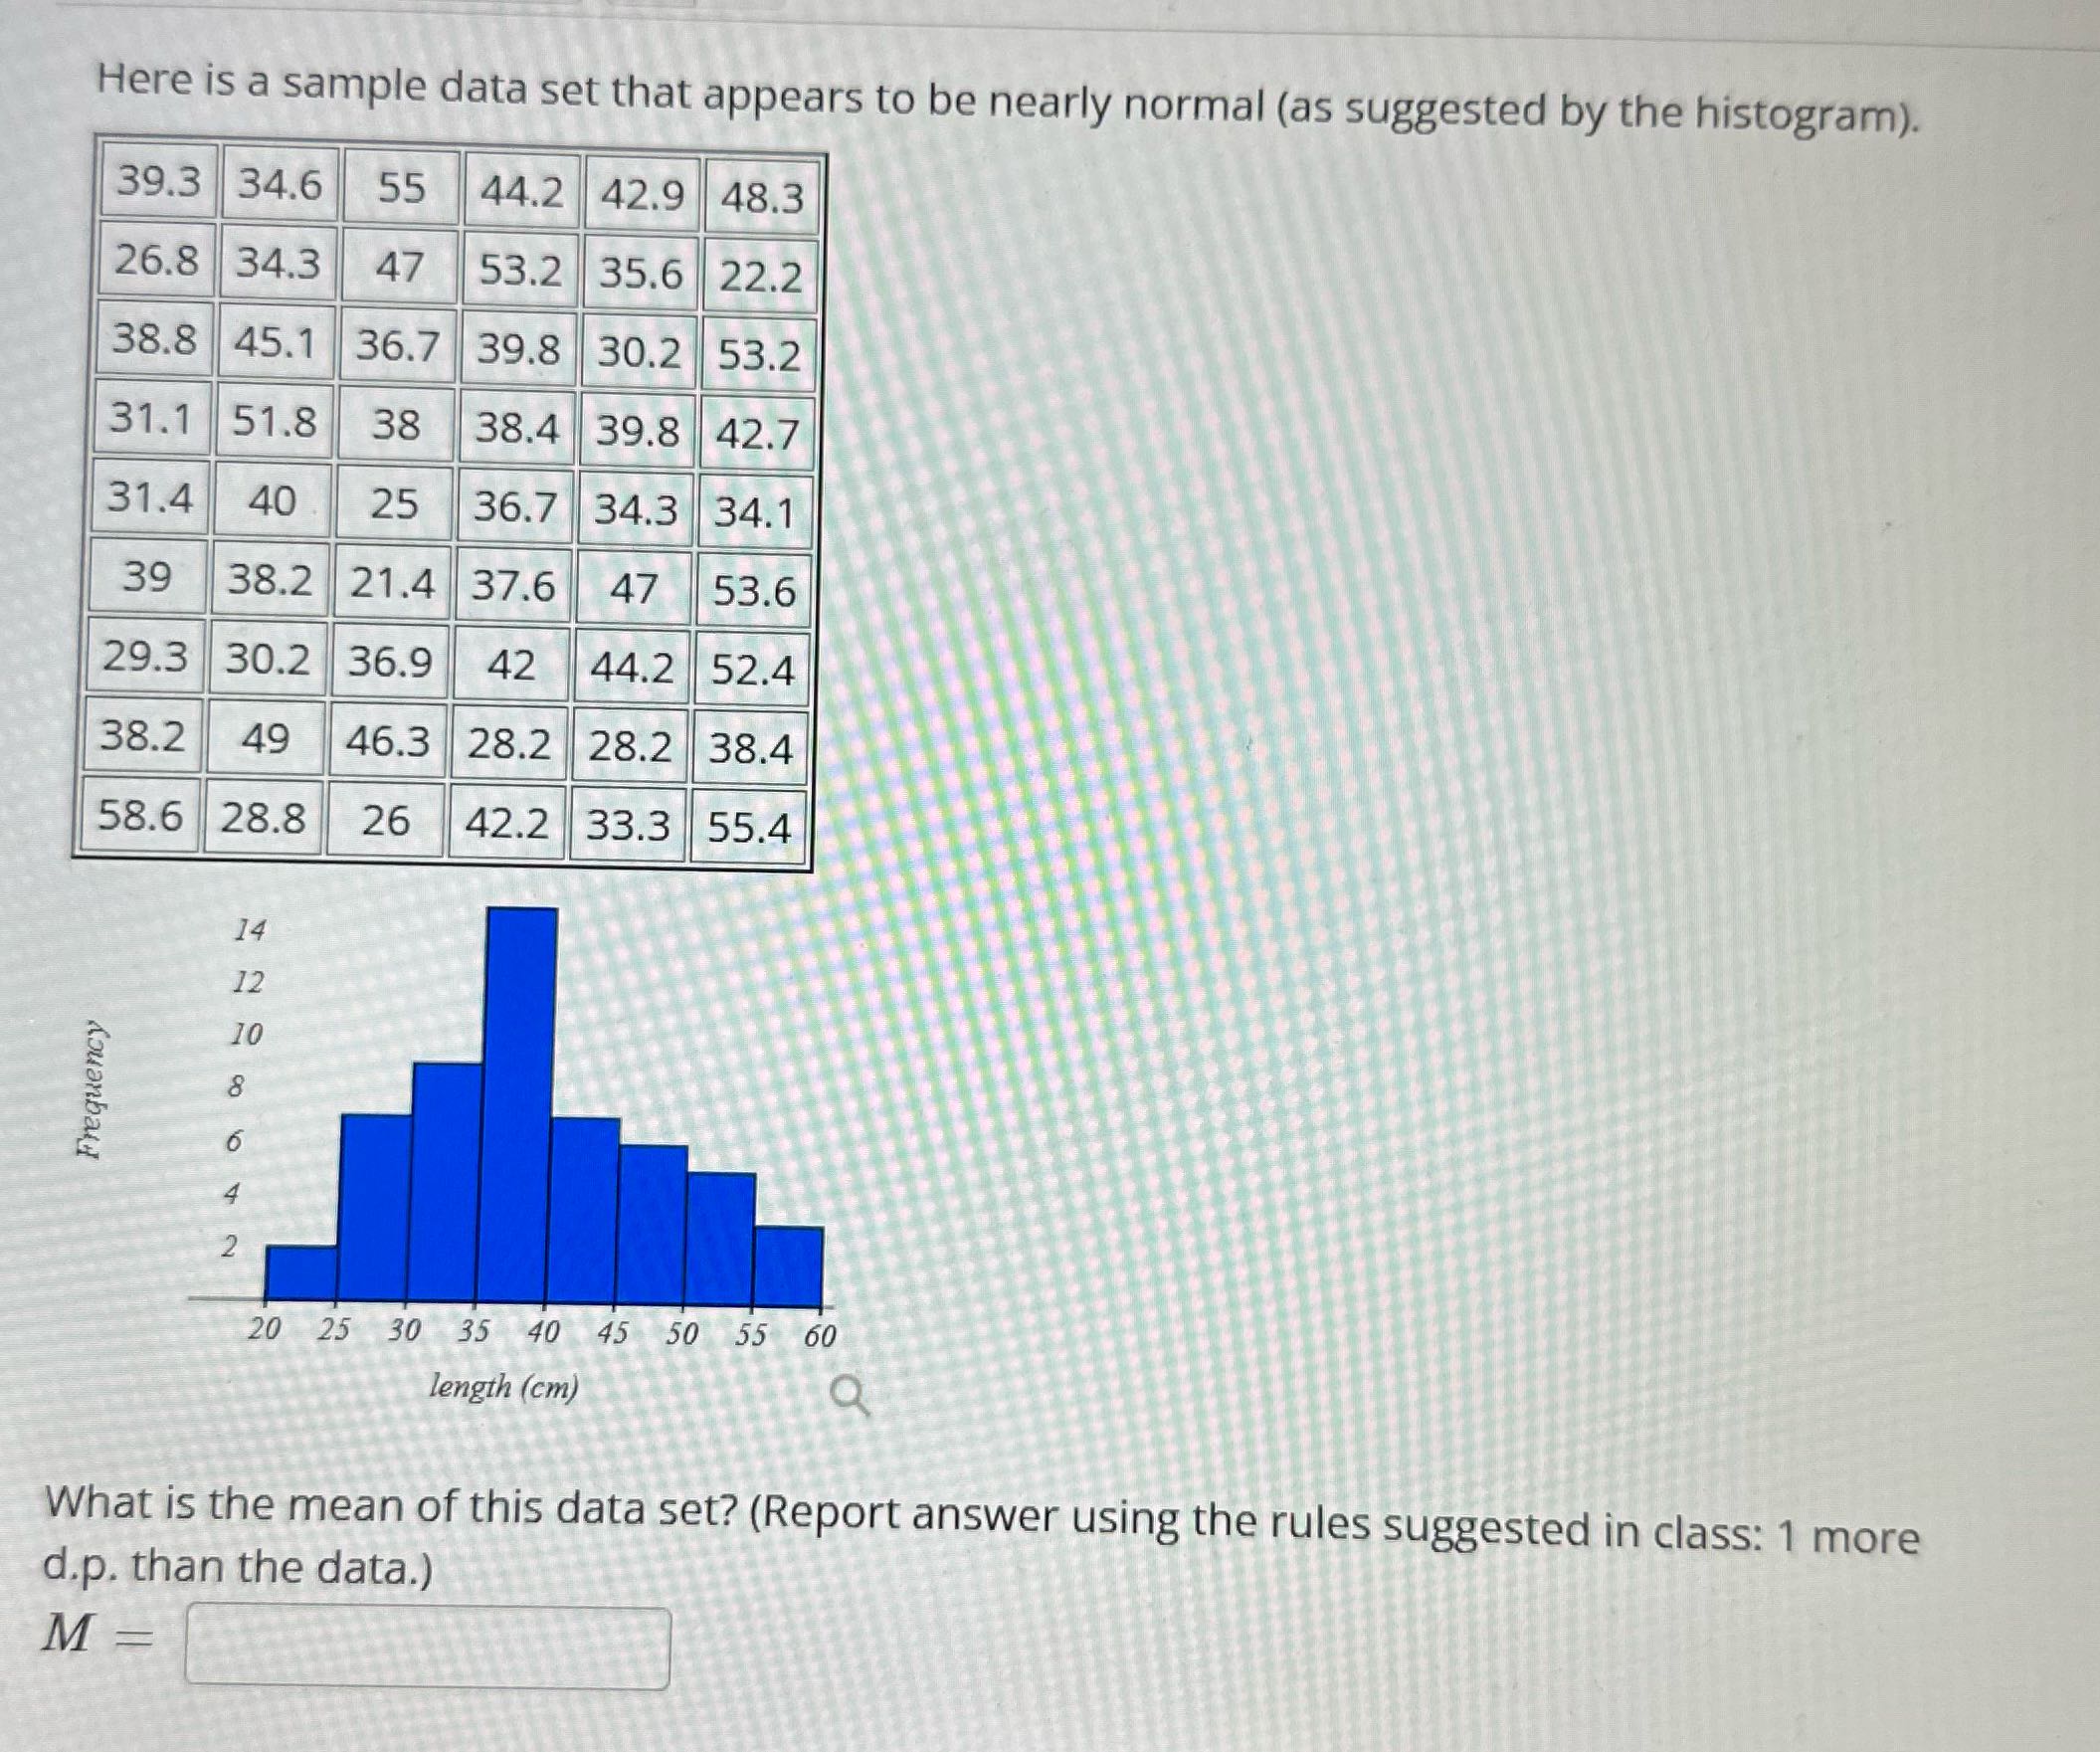
Question: Here is a sample data set that appears to be nearly normal (as suggested by the histogram). 39.3 34.6 55 44.2 42.9 48.3 26.8 34.3

Here is a sample data set that appears to be
Here is a sample data set that appears to be nearly normal (as suggested by the histogram). 39.3 34.6 55 44.2 42.9 48.3 26.8 34.3 47 53.2 35.6 22.2 38.8 45.1 36.7 39.8 30.2 53.2 31.1 51.8 38 38.4 39.8 42.7 31.4 40 25 36.7 34.3 34.1 39 38.2 21.4 37.6 47 53.6 29.3 30.2 36.9 42 44.2 52.4 38.2 49 46.3 28.2 28.2 38.4 58.6 28.8 26 42.2 33.3 55.4 14 12 10 Frequency 20 25 30 35 40 45 50 55 60 length (cm) What is the mean of this data set? (Report answer using the rules suggested in class: 1 more d.p. than the data.) M =

Step by Step Solution

There are 3 Steps involved in it

1 Expert Approved Answer
Step: 1 Unlock blur-text-image
Question Has Been Solved by an Expert!

Get step-by-step solutions from verified subject matter experts

Step: 2 Unlock
Step: 3 Unlock

Students Have Also Explored These Related Accounting Questions!