

Question: Here is a table of (fake) bivariate data: the average annual average temperature in F (Temp.) and the average annual rainfall in inches (Rain) in


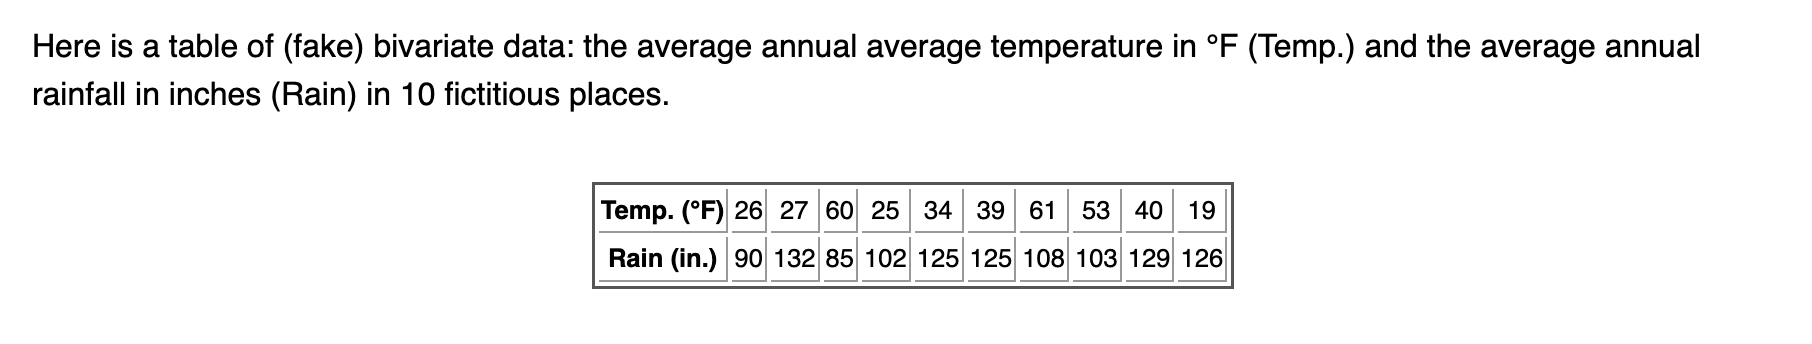
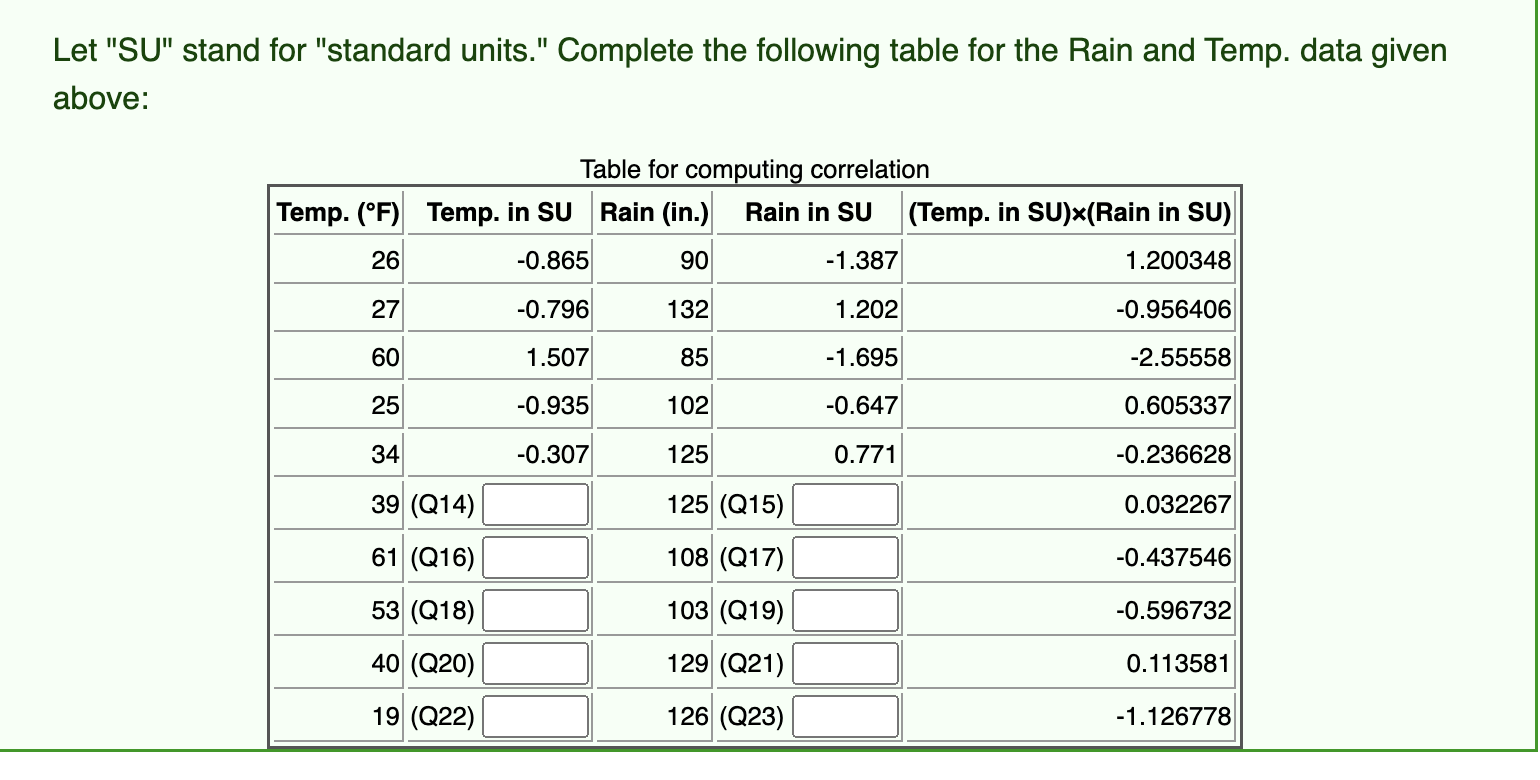
Here is a table of (fake) bivariate data: the average annual average temperature in F (Temp.) and the average annual rainfall in inches (Rain) in 10 fictitious places. Temp. (F) 26| 27l60| 25| 34| 39| 61 | 53| 40| 19| Let "SU" stand for "standard units." Complete the following table for the Rain and Temp. data given above: Table for computing correlation Temp. (F) Temp. in SU Rain (in.) Rain in SU (Temp. in SU)x(Rain in SU) 26 -0.865 90 -1.387 1.200348 27 -0.796 132 1.202 -0.956406 60 1.507 85 -1.695 -2.55558 25 -0.935 102 -0.647 0.605337 34 -0.307 125 0.771 -0.236628 39 (Q14) 125 (Q15) 0.032267 61 (Q16) 108 (Q17) -0.437546 53 (Q18) 103 (Q19) -0.596732 40 (Q20) 129 (Q21) 0. 113581 19 (Q22) 126 (Q23) -1.126778
Step by Step Solution
There are 3 Steps involved in it

Get step-by-step solutions from verified subject matter experts