

Question: here is an example: Question 5 A. Provide common-size analysis of Darden's income statement and balance sheet for 2018 and 2019. B. Provide horizontal analysis
here is an example:
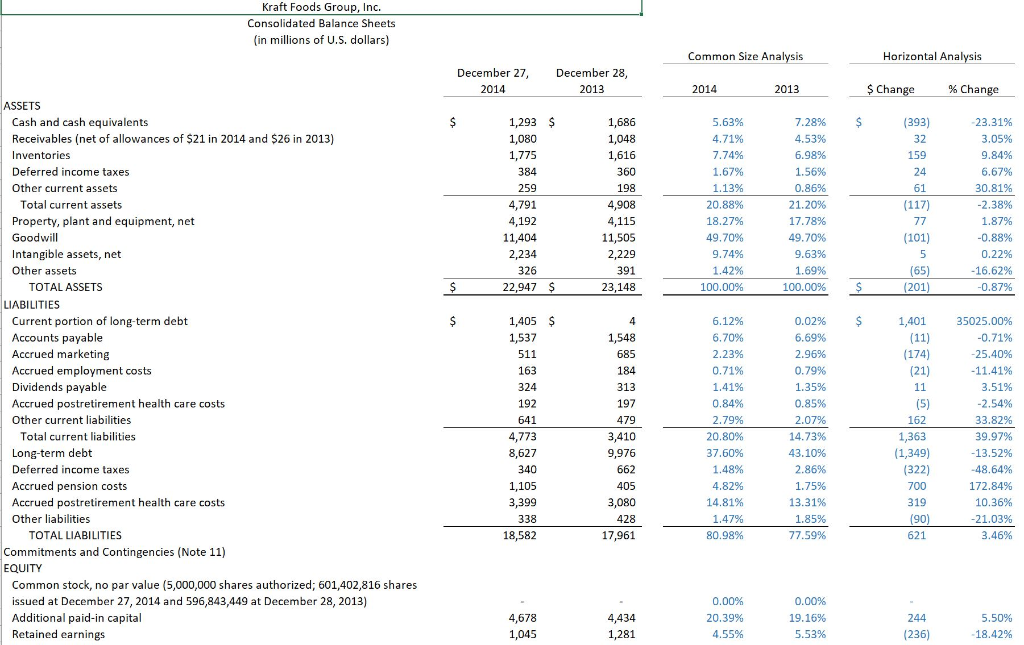

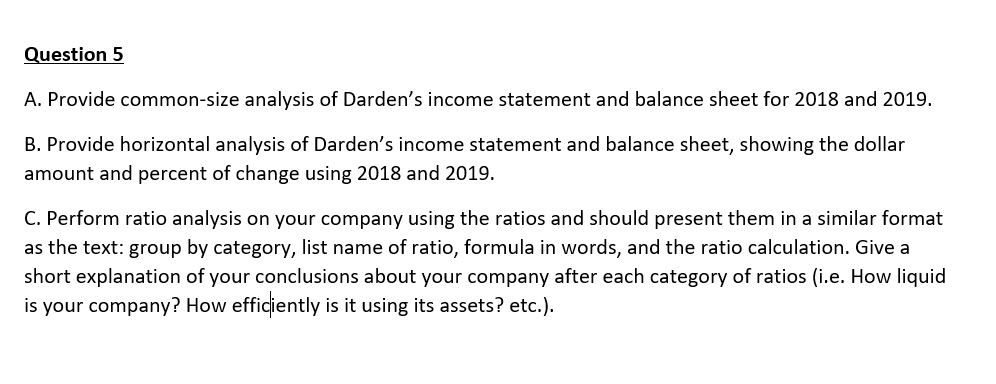
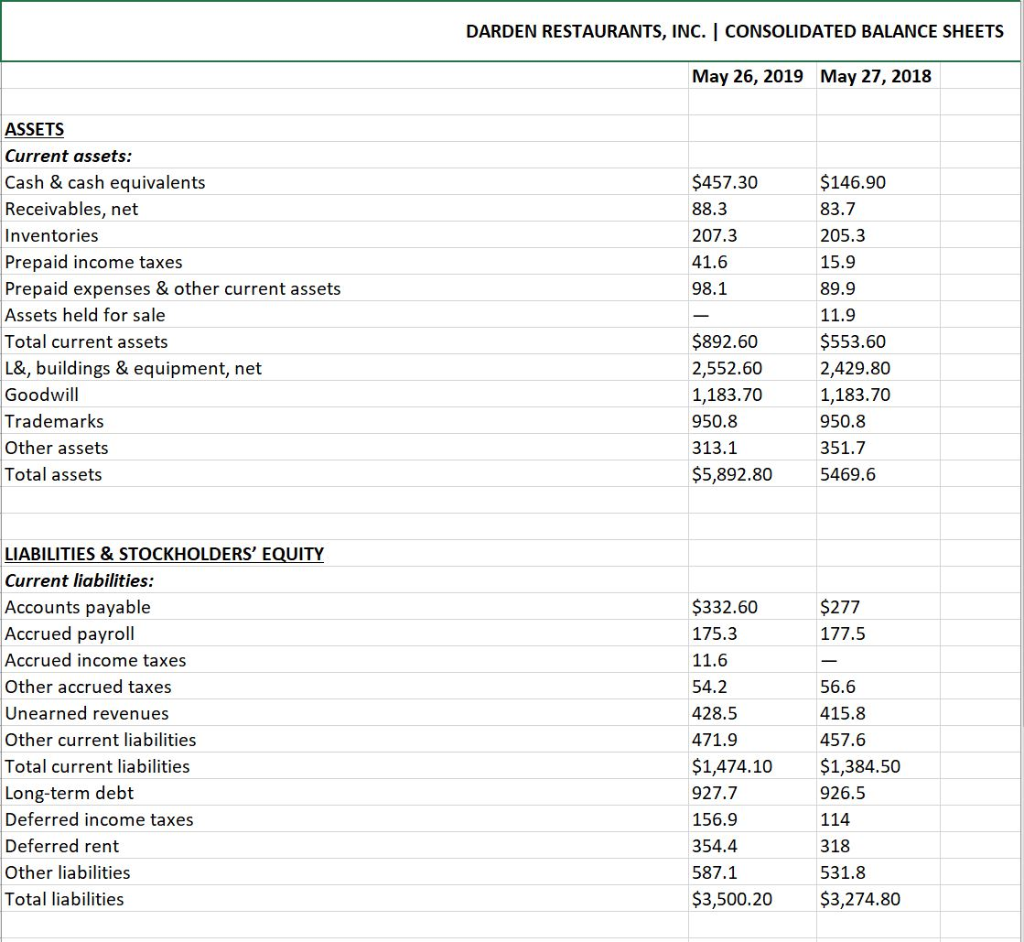
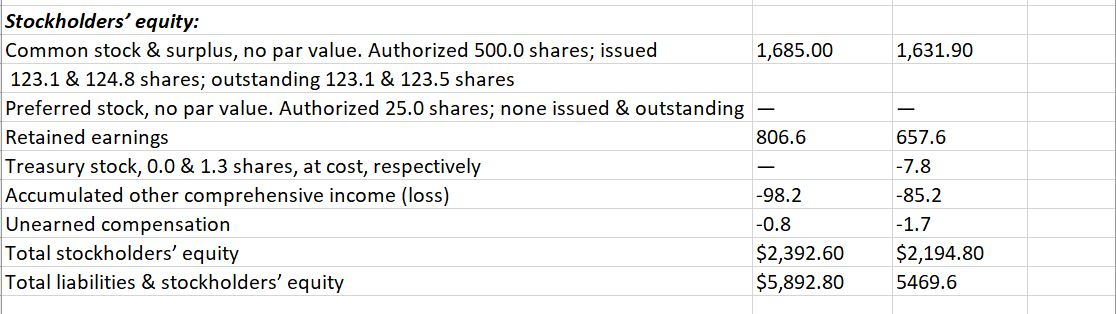
Question 5 A. Provide common-size analysis of Darden's income statement and balance sheet for 2018 and 2019. B. Provide horizontal analysis of Darden's income statement and balance sheet, showing the dollar amount and percent of change using 2018 and 2019. C. Perform ratio analysis on your company using the ratios and should present them in a similar format as the text: group by category, list name of ratio, formula in words, and the ratio calculation. Give a short explanation of your conclusions about your company after each category of ratios (i.e. How liquid is your company? How efficiently is it using its assets? etc.). DARDEN RESTAURANTS, INC. CONSOLIDATED BALANCE SHEETS May 26, 2019 May 27, 2018 $457.30 88.3 207.3 41.6 98.1 ASSETS Current assets: Cash & cash equivalents Receivables, net Inventories Prepaid income taxes Prepaid expenses & other current assets Assets held for sale Total current assets L&, buildings & equipment, net Goodwill Trademarks Other assets Total assets $146.90 83.7 205.3 15.9 89.9 11.9 $553.60 2,429.80 1,183.70 950.8 351.7 5469.6 $892.60 2,552.60 1,183.70 950.8 313.1 $5,892.80 $277 177.5 LIABILITIES & STOCKHOLDERS' EQUITY Current liabilities: Accounts payable Accrued payroll Accrued income taxes Other accrued taxes Unearned revenues Other current liabilities Total current liabilities Long-term debt Deferred income taxes Deferred rent Other liabilities Total liabilities $332.60 175.3 11.6 54.2 428.5 471.9 $1,474.10 927.7 156.9 354.4 587.1 $3,500.20 56.6 415.8 457.6 $1,384.50 926.5 114 318 531.8 $3,274.80 1,631.90 Stockholders' equity: Common stock & surplus, no par value. Authorized 500.0 shares; issued 1,685.00 123.1 & 124.8 shares; outstanding 123.1 & 123.5 shares Preferred stock, no par value. Authorized 25.0 shares; none issued & outstanding Retained earnings 806.6 Treasury stock, 0.0 & 1.3 shares, at cost, respectively Accumulated other comprehensive income (loss) -98.2 Unearned compensation -0.8 Total stockholders' equity $2,392.60 Total liabilities & stockholders' equity $5,892.80 657.6 -7.8 -85.2 -1.7 $2,194.80 5469.6 Kraft Foods Group, Inc. Consolidated Balance Sheets (in millions of U.S. dollars) Common Size Analysis Horizontal Analysis December 27, 2014 December 28, 2013 2014 2013 $ Change % Change $ $ 1,293 $ 1,080 1,775 384 259 4,791 4,192 11,404 2,234 326 22,947 $ 1,686 1,048 1,616 360 198 4,908 4,115 11,505 2,229 391 23,148 5.63% 4.71% 7.74% 1.67% 1.13% 20.88% ser 18.27% 49.70% 9.74% 1.42% 7.28% 4.53% 6.98% 1.56% 0.86% 21.20% 17.78% 49.70% 9.63% 1.69% 100.00% (393) 32 159 24 61 (117) 77 (101) 5 (65) (201) 23.31% 3.05% 9.84% 6.67% 30.81% -2.38% 1.87% -0.88% 0.22% -16.62% -0.87% $ 100.00% $ $ $ 4 1,548 685 ASSETS Cash and cash equivalents Receivables (net of allowances of $21 in 2014 and $26 in 2013) Inventories Deferred income taxes Other current assets Total current assets Property, plant and equipment, net Goodwill Intangible assets, net Other assets TOTAL ASSETS LIABILITIES Current portion of long-term debt Accounts payable Accrued marketing . Accrued employment costs Dividends payable Accrued postretirement health care costs Other current liabilities Total current liabilities Long-term debt Deferred income taxes Accrued pension costs Accrued postretirement health care costs Other liabilities TOTAL LIABILITIES Commitments and Contingencies (Note 11) " EQUITY Common stock, no par value (5,000,000 shares authorized; 601,402,816 shares issued at December 27, 2014 and 596,843,449 at December 28, 2013) Additional paid-in capital Retained earnings 184 313 1,405 $ 1,537 511 162 163 324 192 641 4,773 8,627 340 1,105 3,399 338 18,582 197 479 3,410 9,976 662 405 3,080 428 17,961 6.12% 6.70% 2.23% 0.71% 1102 1.41% 0.84% 200 2.79% 20.80% 37.60% 1.48% 4.82% 14.81% 1.47% 80.98% 0.02% 6.69% 2.96% 0.79% 1.35% 0.85% 2.07% 14.73% 43.10% 2.86% 1.75% 13.31% 1.85% 77.59% 1,401 (11) (174) (21) 11 (5) 162 1,363 (1,349) (322) 700 319 (90) 621 35025.00% -0.71% -25.40% - 11.41% 3.51% -2.54% 33.82% 10 39.97% -13.52% -48.64% 172.84% 10.36% -21.03% 3.46% 4,678 1,045 4,434 1,281 0.00% 20.39% 4.55% 0.00% 19.16% 5.53% 244 (236) 5.50% 18.42% Retained earnings Accumulated other comprehensive losses Treasury stock, at cost TOTAL EQUITY TOTAL LIABILITIES AND EQUITY 1,045 (562) (796) 4,365 22,947 1,281 (499) (29) 5,187 23,148 4.55% -2.45% -3.47% 19.02% 100.00% 5.53% -2.16% -0.13% 22.41% 100.00% (236) (63) (767) (822) (201) -18.42% 12.63% 2644.83% - 15.85% -0.87%
Step by Step Solution
There are 3 Steps involved in it

Get step-by-step solutions from verified subject matter experts