

Question: here is appendix A: Use Apple's financial statements in Appendix A to answer the following. Required: 1. Using fiscal 2017 as the base year, compute
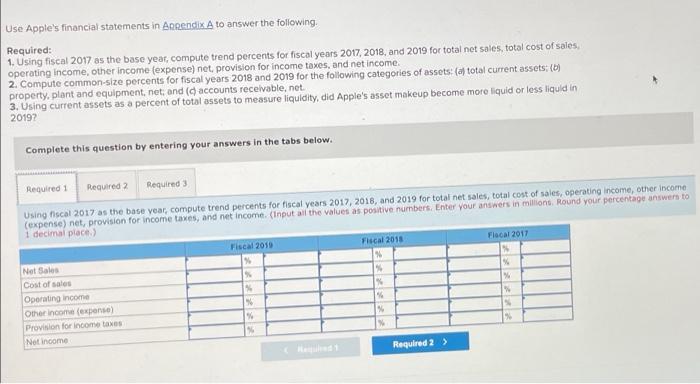
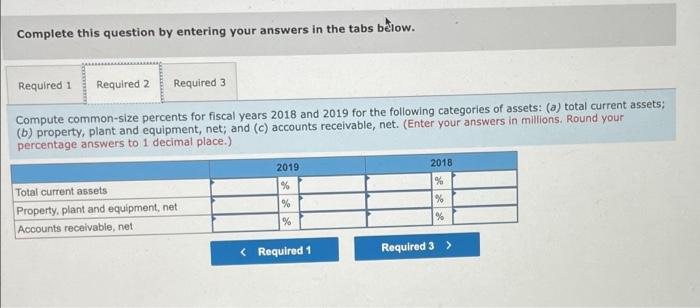
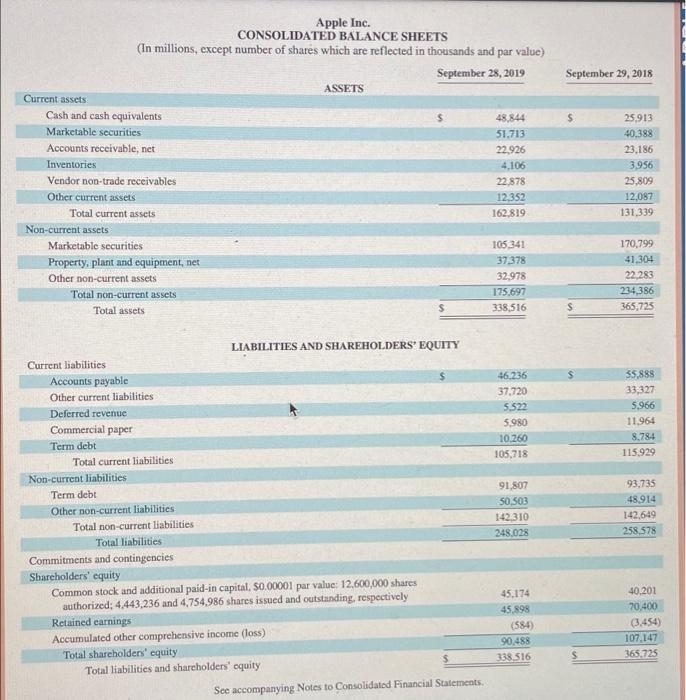
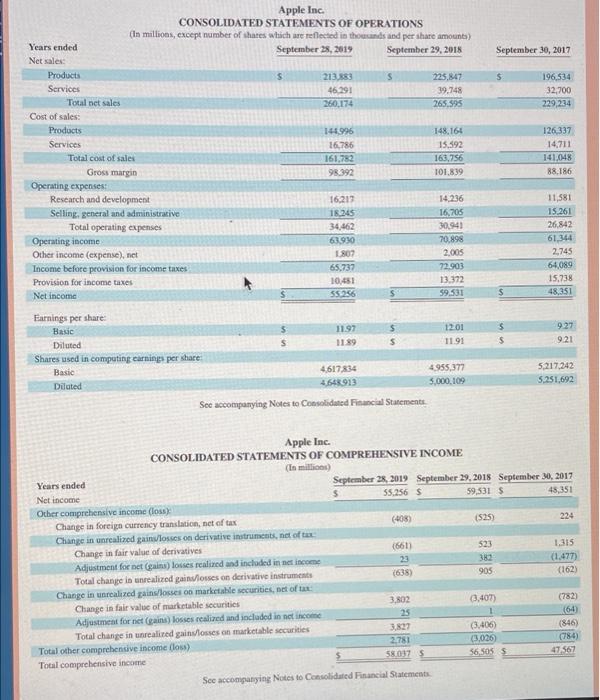
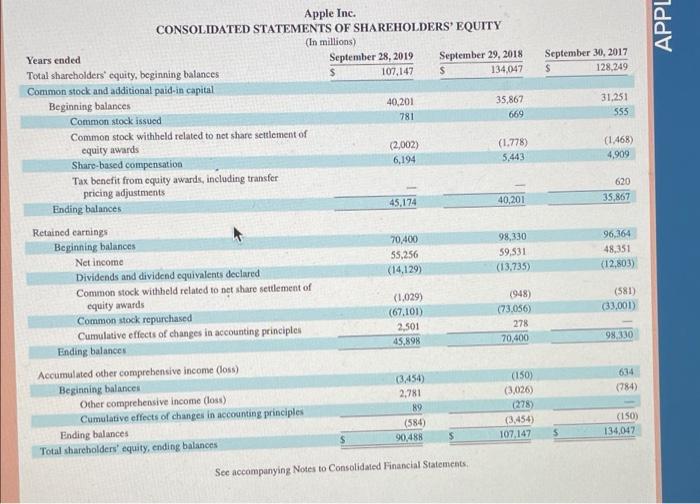
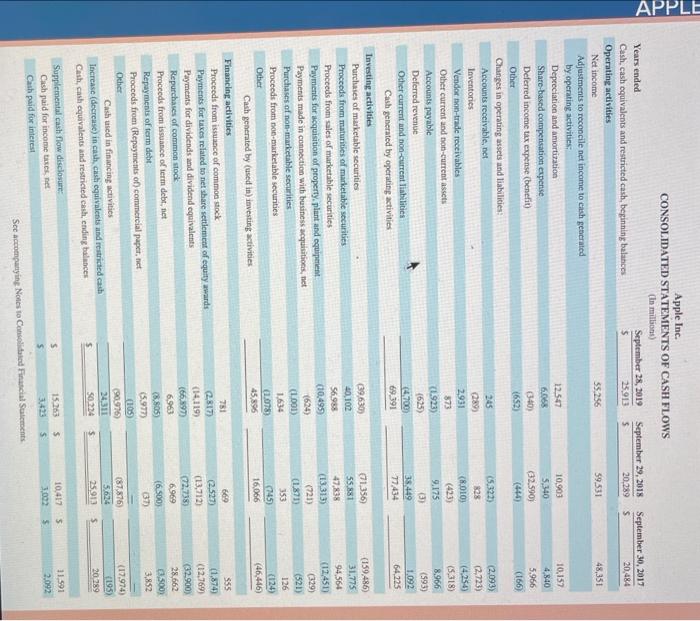
Use Apple's financial statements in Appendix A to answer the following. Required: 1. Using fiscal 2017 as the base year, compute trend percents for fiscal years 2017, 2018, and 2019 for total net sales, total cost of sales, operating income, other income (expense) net, provision for income taxes, and net income. 2. Compute common-size percents for fiscal years 2018 and 2019 for the following categories of assets: (a) total current assets; (b) property, plant and equipment, net; and (c) accounts receivable, net.. 3. Using current assets as a percent of total assets to measure liquidity, did Apple's asset makeup become more liquid or less liquid in 2019? Complete this question by entering your answers in the tabs below. Required 1 Required 2 Required 3 Using fiscal 2017 as the base year, compute trend percents for fiscal years 2017, 2018, and 2019 for total net sales, total cost of sales, operating income, other income (expense) net, provision for income taxes, and net income. (Input all the values as positive numbers. Enter your answers in millions. Round your percentage answers to 1 decimal place.) Net Sales Cost of sales Operating income Other income (expense) Provision for income taxes Net income Fiscal 2019 % % % % % % Fiscal 2018 % % % % % % Required 2 > Fiscal 2017 % % % % N % Complete this question by entering your answers in the tabs below. Required 1 Required 2 Required 3 Compute common-size percents for fiscal years 2018 and 2019 for the following categories of assets: (a) total current assets; (b) property, plant and equipment, net; and (c) accounts receivable, net. (Enter your answers in millions. Round your percentage answers to 1 decimal place.) Total current assets Property, plant and equipment, net Accounts receivable, net 2019 % % % Current assets Cash and cash equivalents Marketable securities Accounts receivable, net Inventories Vendor non-trade receivables Other current assets Total current assets Non-current assets Apple Inc. CONSOLIDATED BALANCE SHEETS (In millions, except number of shares which are reflected in thousands and par value) September 28, 2019 Marketable securities Property, plant and equipment, net Other non-current assets Total non-current assets Total assets Current liabilities. Accounts payable Other current liabilities Deferred revenue Commercial paper Term debt Total current liabilities i Non-current liabilities Term debt Other non-current liabilities ASSETS LIABILITIES AND SHAREHOLDERS' EQUITY Total non-current liabilities Total liabilities Commitments and contingencies Shareholders' equity Common stock and additional paid-in capital, $0.00001 par value: 12,600,000 shares authorized; 4,443,236 and 4,754,986 shares issued and outstanding, respectively Retained earnings Accumulated other comprehensive income (loss) Total shareholders' equity Total liabilities and shareholders' equity $ $ $ See accompanying Notes to Consolidated Financial Statements. 48,844 51,713 22,926 4,106 22,878 12.352 162,819 105.341 37,378 32,978 175,697 338,516 46,236 37,720 5,522 5,980 10,260 105,718 91,807 50,503 142,310 248,028 45,174 45,898 (584) 90,488 338,516 September 29, 2018 $ $ S 25,913 40,388 23,186 3,956 25,809 12,087 131,339 170,799 41,304 22,283 234,386 365,725 55,888 33,327 5,966 11,964 8.784 115,929 93,735 48,914 142,649 258,578 40,201 70,400 (3454) 107,147 365,725 Years ended. Net sales: Products Services Total net sales Cost of sales: Products Services Apple Inc. CONSOLIDATED STATEMENTS OF OPERATIONS (In millions, except number of shares which are reflected in thousands and per share amounts) September 28, 2019 September 29, 2018 Total cost of sales Gross margin Operating expenses: Research and development Selling, general and administrative Total operating expenses Operating income Other income (expense), net Income before provision for income taxes Provision for income taxes Net income Earnings per share: Basic Diluted Shares used in computing earnings per share: Basic Diluted $ Years ended Net income Other comprehensive income (loss) 213,883 46,291 260,174 144,996 16,786 161,782 98.392 Change in foreign currency translation, net of tax Change in unrealized gains/losses on derivative instruments, net of tax Change in fair value of derivatives Adjustment for net (gains) losses realized and included in net income Total change in unrealized gains/losses on derivative instruments Change in unrealized gains/losses on marketable securities, net of tax Change in fair value of marketable securities Adjustment for net (gains) losses realized and included in net income Total change in unrealized gains/losses on marketable securities Total other comprehensive income (loss) Total comprehensive income 16,217 18,245 34,462 63,930 1.807 65,737 10,481 55,256 11.97 11.89 S 4,617,834 4,648.913 See accompanying Notes to Consolidated Financial Statements S S $ $ $ Apple Inc. CONSOLIDATED STATEMENTS OF COMPREHENSIVE INCOME (In millions) (408) 225,847 39,748 265.595 (661) 23 (638) 148,164 15,592 163,756 101,839 3,802 25 3,827 2,781 58.037 S See accompanying Notes to Consolidated Financial Statements. 14,236 16,705 30,941 70,898 2,005 72,903 13,372 59.531 12.01 11.91 4,955,377 5,000,109 September 28, 2019 September 29, 2018 55,256 S 59,531 $ (525) September 30, 2017 523 382 905 $ $ (3,407) $ $ 196,534 32,700 229,234 (3,406) (3,026) 56,505 $ 126,337 14,711 141,048 88,186 11,581 15,261 26,842 61,344 2,745 64,089 15,738 48,351 9:27 9.21 September 30, 2017 48,351 5,217,242 5,251,692 224 1,315 (1,477) (162) (782) (64) (846) (784) 47,567 Years ended Total shareholders' equity, beginning balances Common stock and additional paid-in capital Beginning balances Common stock issued Common stock withheld related to net share settlement of equity awards Share-based compensation Tax benefit from equity awards, including transfer pricing adjustments Ending balances Retained earnings Beginning balances Net income Apple Inc. CONSOLIDATED STATEMENTS OF SHAREHOLDERS' EQUITY (In millions) Dividends and dividend equivalents declared Common stock withheld related to net share settlement of equity awards Common stock repurchased Cumulative effects of changes in accounting principles Ending balances Accumulated other comprehensive income (loss) Beginning balances Other comprehensive income (loss) Cumulative effects of changes in accounting principles Ending balances Total shareholders' equity, ending balances September 28, 2019 107,147 40,201 781 (2,002) 6,194 45,174 70,400 55,256 (14,129) (1,029) (67,101) 2,501 45,898 (3,454) 2,781 89 (584) 90,488 September 29, 2018. $ 134,047 $ See accompanying Notes to Consolidated Financial Statements. 35,867 669 (1.778) 5,443 40,201 98,330 59,531 (13,735) (948) (73,056) 278 70,400 (150) (3,026) (278) (3,454) 107,147 September 30, 2017 128,249 5 31,251 555 (1468) 4,909 620 35,867 96,364 48,351 (12,803) (581) (33,001) 98,330 634 (784) (150) 134,047 APPL APPLE Apple Inc. CONSOLIDATED STATEMENTS OF CASH FLOWS (In millions) Years ended Cash, cash equivalents and restricted cash, beginning balances Operating activities Net income Adjustments to reconcile net income to cash generated by operating activities: Depreciation and amortization Share-based compensation expense Deferred income tax expense (benefit) Other Changes in operating assets and liabilities: Accounts receivable, net Inventories Vendor non-trade receivables Other current and non-current assets Accounts payable Deferred revenue Other current and non-current liabilities Cash generated by operating activities Investing activities Purchases of marketable securities Proceeds from maturities of marketable securities Proceeds from sales of marketable securities Payments for acquisition of property, plant and equipment Payments made in connection with business acquisitions, net Purchases of non-marketable securities Proceeds from non-marketable securities Other Cash generated by (used in) investing activities Financing activities Proceeds from issuance of common stock Payments for taxes related to net share settlement of equity awards Payments for dividends and dividend equivalents Repurchases of common stock Proceeds from issuance of term debt, net Repayments of term debt Proceeds from (Repayments of) commercial paper, net Other Cash used in financing activities Increase (decrease) in cash, cash equivalents and restricted cash Cash, cash equivalents and restricted cash, ending balances Supplemental cash flow disclosure: Cash paid for income taxes, net Cash paid for interest September 28, 2019 $ 25.913 55,256 12,547 6.068 (340) (652) 245 (289) 2,931 873 (1923) (625) (4.700) 69,391 (39,630) 40,102 56,988 (10,495) (624) (1,001) 1,634 (1078) 45,896 781 (2,817) (14,119) (66,897) 6.963 (8.805) (5.977) (105) (90,976) 24,311 50.224 15.263 3,423 September 29, 2018 20,289 S $ $ S S See accompanying Notes to Consolidated Financial Statements 59.531 10,903 5,340 (32,590) (444) (5.322) 828 (8.010) (423) 9.175 (3) 38,449 77434 (71,356) 55.881 47,838 (13.313) (721) (1871) 353 (745) 16,066 669 (2,527) (13,712) (72,738) 6,969 (6,500) (37) September 30, 2017 20,484 (87,876) 5,624 25.913 $ 10,417 S 3,022 $ 48,351 10,157 4,840 5.966 (166) (2,093) (2,723) (4,254) (5,318) 8,966 (593) 1,092 64,225 (159,486) 31.775 94,564 (12,451) (329) (521) 126 (124) (46,446) 555 (1,874) (12,769) (32,900) 28,662 (3,500) 3,852 (17,974) (195) 20,289 11,591 2,092
Step by Step Solution
There are 3 Steps involved in it

Get step-by-step solutions from verified subject matter experts