

Question: Here is Appendix B: Here is Appendix C: Critical Thinking 14-02 a1,b (Part Level Submission) PepsiCo, Inc.'s financial statements are presented in Appendix B. Click
Here is Appendix B:
Here is Appendix C:
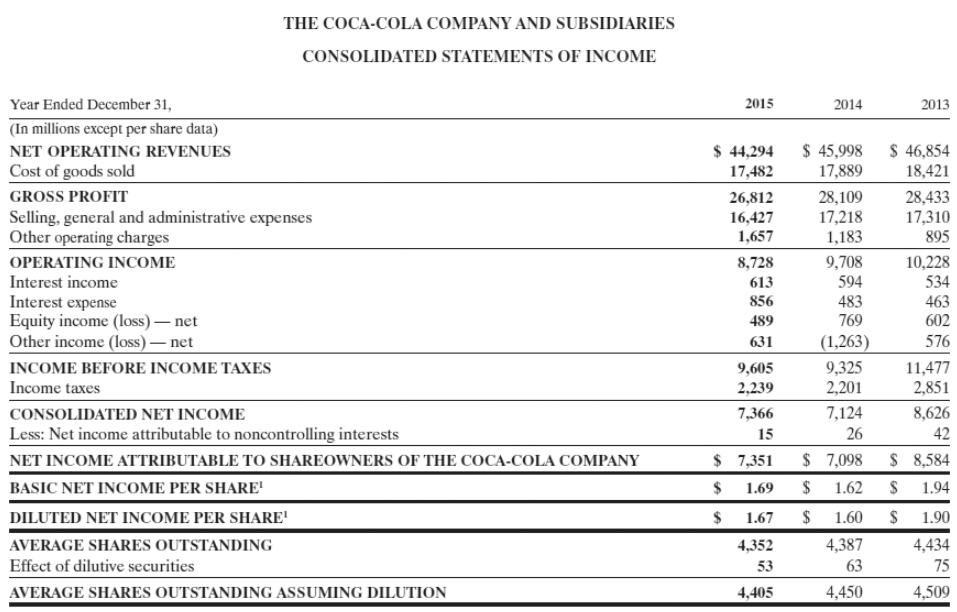
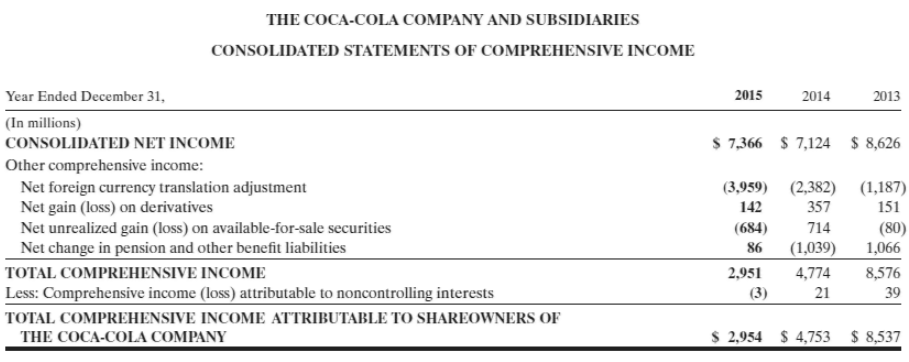
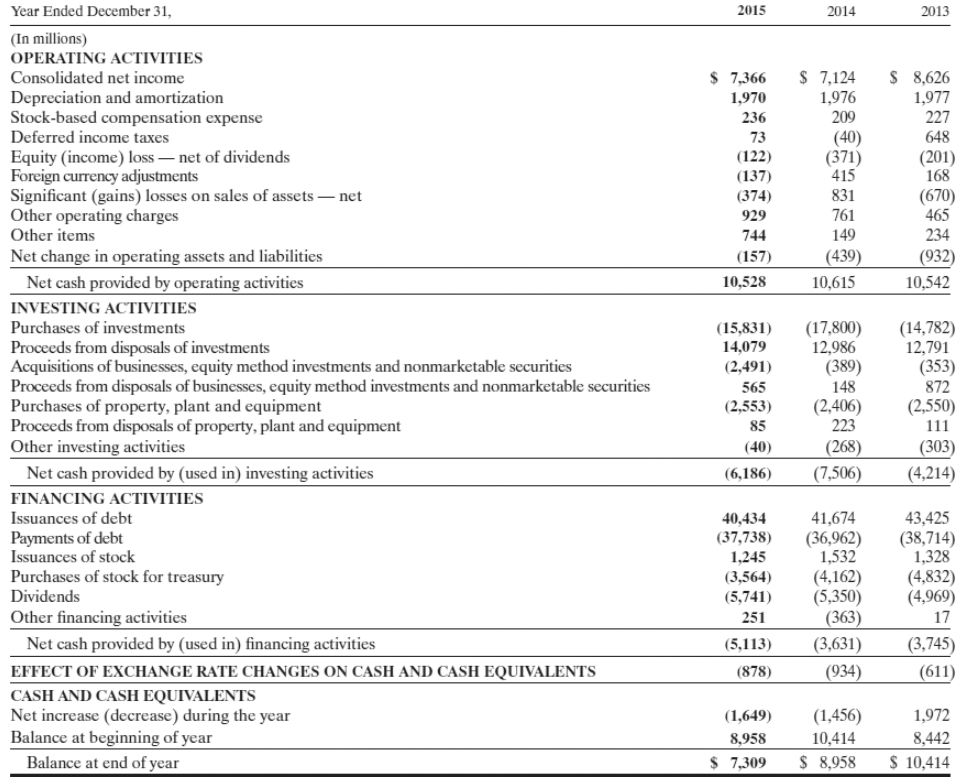
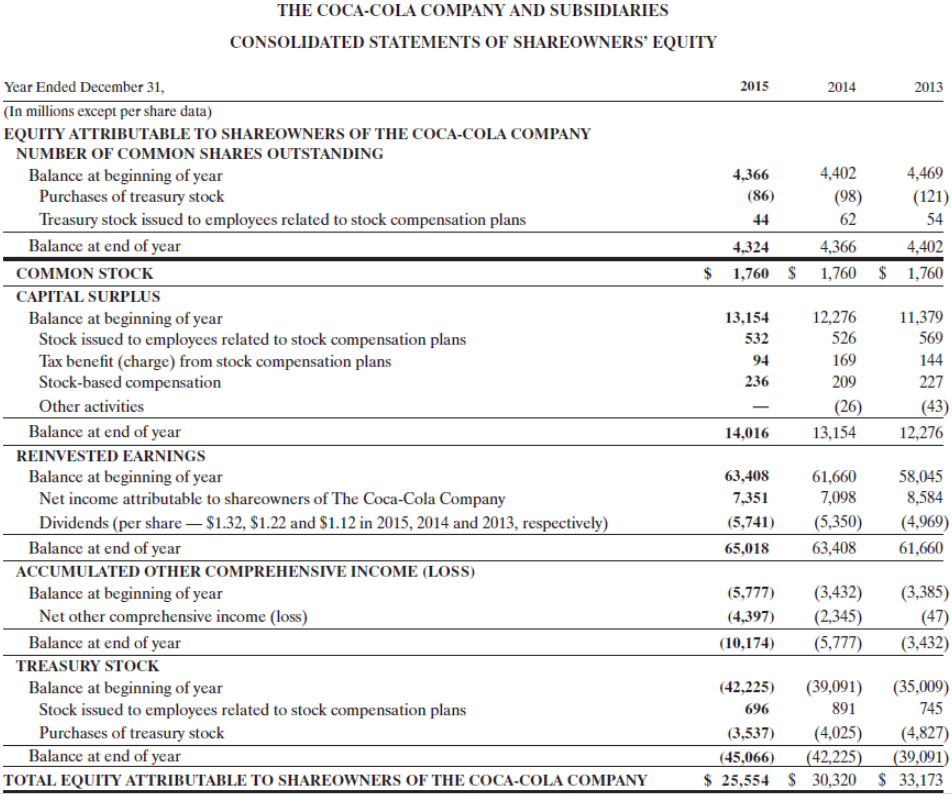
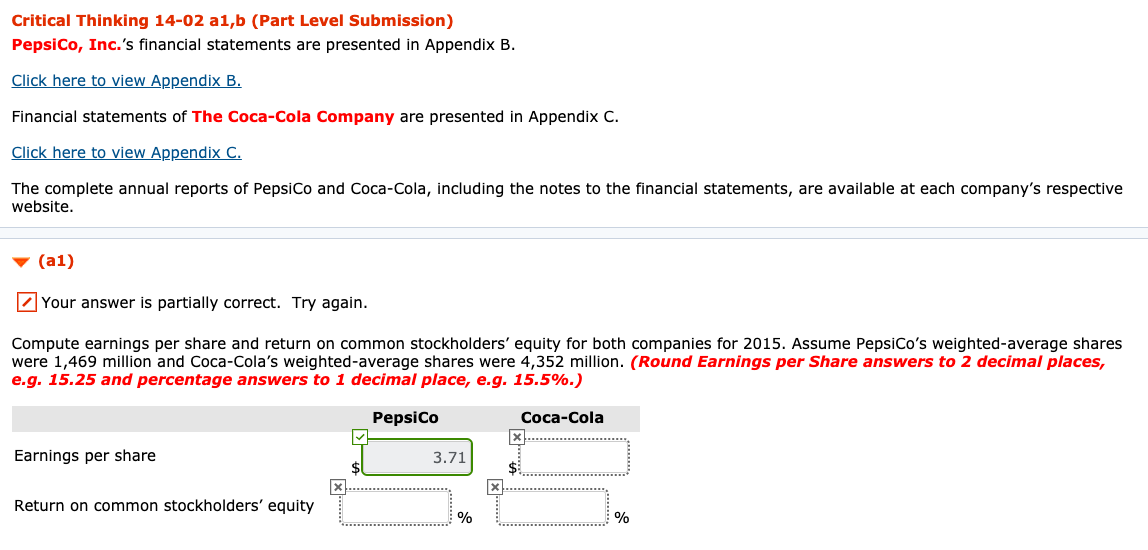
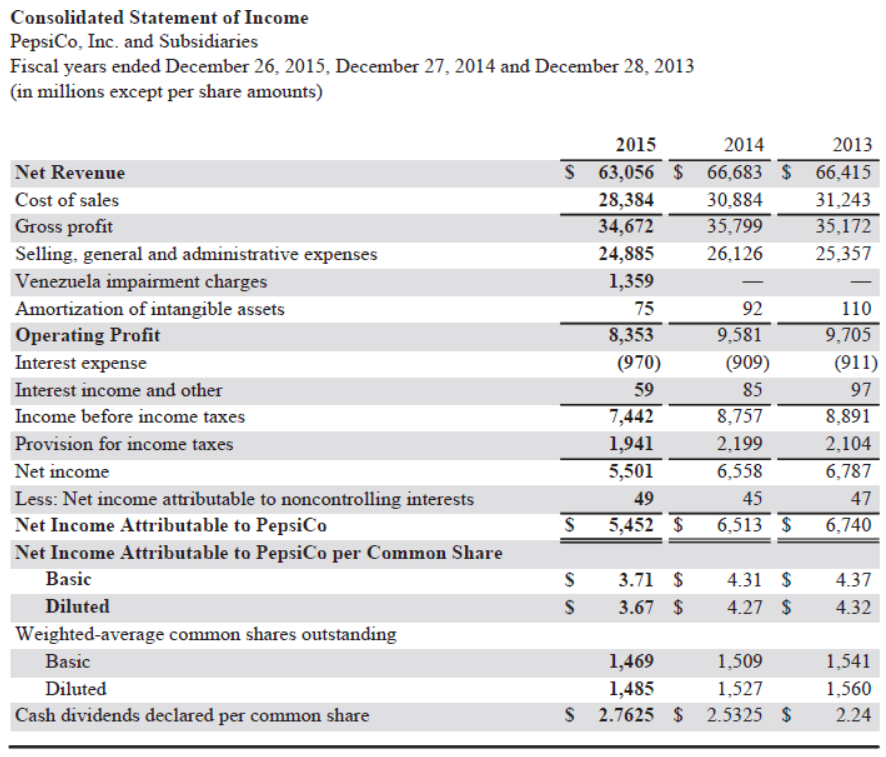
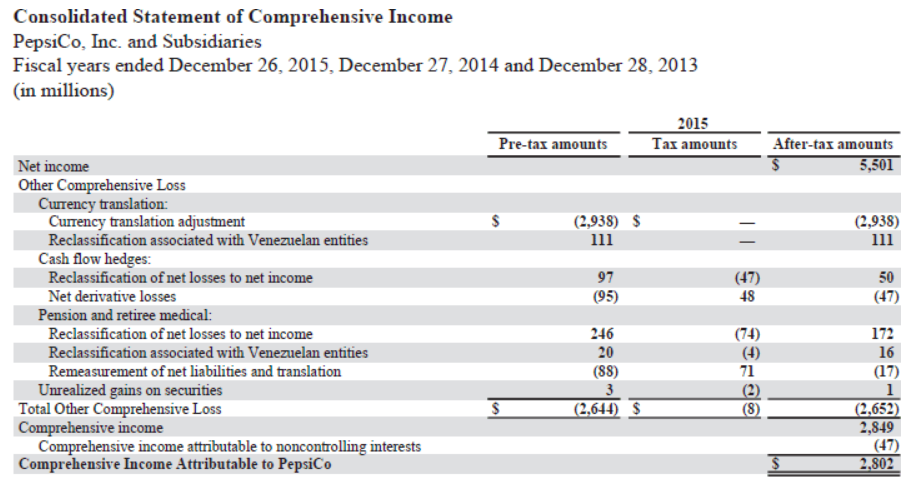
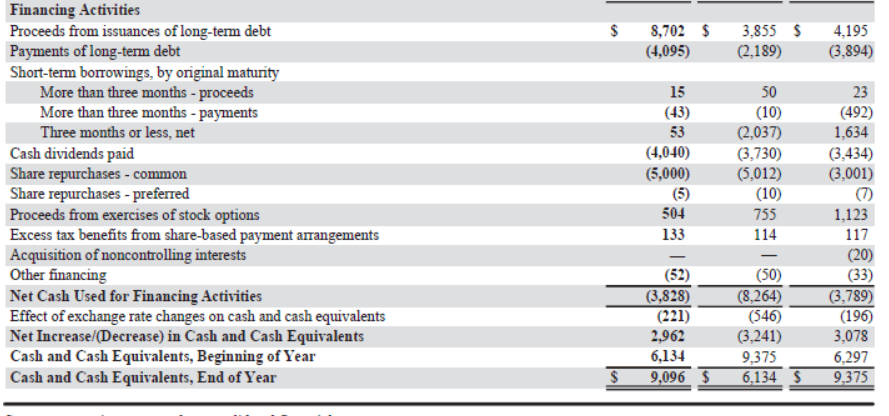
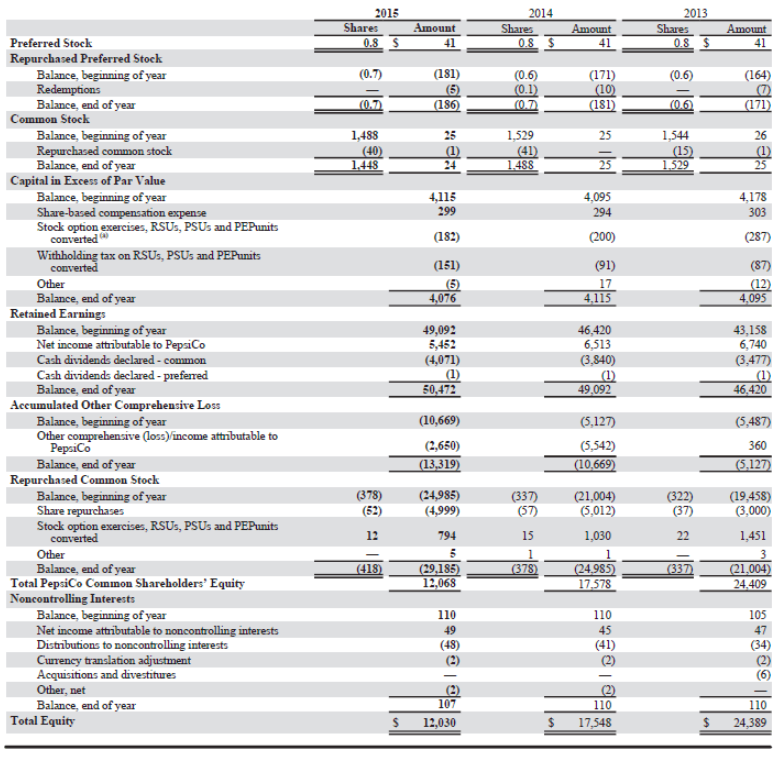
Critical Thinking 14-02 a1,b (Part Level Submission) PepsiCo, Inc.'s financial statements are presented in Appendix B. Click here to view Appendix B. Financial statements of The Coca-Cola Company are presented in Appendix C. Click here to view Appendix C. The complete annual reports of PepsiCo and Coca-Cola, including the notes to the financial statements, are available at each company's respective website. (a1) Your answer is partially correct. Try again. Compute earnings per share and return on common stockholders' equity for both companies for 2015. Assume PepsiCo's weighted average shares were 1,469 million and Coca-Cola's weighted average shares were 4,352 million. (Round Earnings per Share answers to 2 decimal places, e.g. 15.25 and percentage answers to 1 decimal place, e.g. 15.5%.) PepsiCo Coca-Cola Earnings per share 3.71 X Return on common stockholders' equity % % Consolidated Statement of Income PepsiCo, Inc. and Subsidiaries Fiscal years ended December 26, 2015, December 27, 2014 and December 28, 2013 (in millions except per share amounts) 2014 2013 66,683 $ 66,415 30,884 31,243 35,799 35,172 26.126 25,357 Net Revenue Cost of sales Gross profit Selling, general and administrative expenses Venezuela impairment charges Amortization of intangible assets Operating Profit Interest expense Interest income and other Income before income taxes Provision for income taxes Net income Less: Net income attributable to noncontrolling interests Net Income Attributable to PepsiCo Net Income Attributable to PepsiCo per Common Share Basic Diluted Weighted-average common shares outstanding Basic Diluted Cash dividends declared per common share 2015 $ 63,056 $ 28,384 34,672 24,885 1,359 75 8,353 (970) 59 7,442 1,941 5,501 49 S 5,452 $ 92 9,581 (909) 85 8,757 2,199 6,558 45 6,513 $ 110 9,705 (911) 97 8,891 2.104 6,787 47 6,740 $ $ 3.71 $ 3.67 $ 4.31 $ 4.27 $ 4.37 4.32 1,469 1,485 $ 2.7625 $ 1,509 1,527 2.5325 $ 1,541 1,560 2.24 After-tax amounts 5,501 $ Consolidated Statement of Comprehensive Income PepsiCo, Inc. and Subsidiaries Fiscal years ended December 26, 2015, December 27, 2014 and December 28, 2013 (in millions) 2015 Pre-tax amounts Tax amounts Net income Other Comprehensive Loss Currency translation: Currency translation adjustment (2,938) $ Reclassification associated with Venezuelan entities 111 Cash flow hedges: Reclassification of net losses to net income 97 (47) Net derivative losses (95) 48 Pension and retiree medical: Reclassification of net losses to net income 246 Reclassification associated with Venezuelan entities 20 Remeasurement of net liabilities and translation (88) 71 Unrealized gains on securities 3 Total Other Comprehensive Loss $ (2,644) $ (8) Comprehensive income Comprehensive income attributable to noncontrolling interests Comprehensive Income Attributable to PepsiCo (2,938) 111 50 (47) 172 16 (17) 1 (2,652) 2,849 (47) 2.802 $ 8,702 $ (4,095) 3,855 $ (2,189) 4,195 (3,894) 15 50 (43) 53 (4,0-40) (5,000) Financing Activities Proceeds from issuances of long-term debt Payments of long-term debt Short-term borrowings, by original maturity More than three months - proceeds More than three months - payments Three months or less, net Cash dividends paid Share repurchases - common Share repurchases - preferred Proceeds from exercises of stock options Excess tax benefits from share-based payment arrangements Acquisition of noncontrolling interests Other financing Net Cash Used for Financing Activities Effect of exchange rate changes on cash and cash equivalents Net Increase/(Decrease) in Cash and Cash Equivalents Cash and Cash Equivalents, Beginning of Year Cash and Cash Equivalents, End of Year 23 (492) 1,634 (3,434) (3,001) (10) (2,037) (3,730) (5.012) (10) 755 114 504 133 (52) (3,828) (221) 2,962 6,134 9,096 $ (50) (8,264) (546) (3,241) 9,375 6,134 $ 1,123 117 (20) (33) (3,789) (196) 3,078 6,297 9,375 $ 2015 Shares Amount 0.85 41 2014 Shares 0.8 $ Amount 41 2013 Shares 0.8 $ Amount 41 (0.7) (0.6) (181) (5) (186) (0.6) (0.1) 007 (171) (10) (181) (164) (7) (171) (0.7 (0.0 1,529 25 1,488 (40) 1.448 25 (1) 1,544 (15) 1.529 26 (1) 25 1.488 25 4,115 299 4.095 294 4,178 303 (182) (200) (287) (151) (91) (87) (12) 4,095 17 4.115 4,076 49,092 5,452 (4,071) Preferred Stock Repurchased Preferred Stock Balance, beginning of year Redemptions Balance, end of year Common Stock Balance, beginning of year Repurchased common stock Balance, end of year Capital in Excess of Par Value Balance, beginning of year Share-based compensation expense Stock option exercises, RSUS, PSUs and PEPunits converted Withholding tax on RSUS, PSUs and PEPunits converted Other Balance, end of year Retained Earnings Balance, beginning of year Net income attributable to PepsiCo Cash dividends declared - common Cash dividends declared - preferred Balance, end of year Accumulated Other Comprehensive Loss Balance, beginning of year Other comprehensive (loss)income attributable to PepsiCo Balance, end of year Repurchased Common Stock Balance, beginning of year Share repurchases Stock option exercises, RSUS, PSUs and PEPunits converted Other Balance, end of year Total PepsiCo Common Shareholders' Equity Noncontrolling Interests Balance, beginning of year Net income attributable to noncontrolling interests Distributions to noncontrolling interests Currency translation adjustment Acquisitions and divestitures Other, net Balance, end of year Total Equity 46,420 6,513 (3.840) (1) 49,092 43,158 6,740 (3,477) (1) 46.420 50,472 (10,669) (2,650) (13,319) (5.127) (5.542) (10,669) (5,487) 360 (5,127) (378) (24,985) (4,999) 794 5 (29,185 12,068 (337) (57) 15 (21,004) (5.012) 1.030 (322) (37) 22 12 (19,458) (3.000) 1,451 3 (21,004) 24.409 (418) (378) (337) (24.985) 17.578 105 110 49 (48) 110 45 (41) (2) 110 107 12,030 110 24,389 $ 17,548 THE COCA-COLA COMPANY AND SUBSIDIARIES CONSOLIDATED STATEMENTS OF INCOME 2015 2014 2013 Year Ended December 31, (In millions except per share data) NET OPERATING REVENUES Cost of goods sold GROSS PROFIT Selling, general and administrative expenses Other operating charges OPERATING INCOME Interest income Interest expense Equity income (loss) net Other income (loss) net INCOME BEFORE INCOME TAXES Income taxes CONSOLIDATED NET INCOME Less: Net income attributable to noncontrolling interests NET INCOME ATTRIBUTABLE TO SHAREOWNERS OF THE COCA-COLA COMPANY BASIC NET INCOME PER SHARE DILUTED NET INCOME PER SHARE AVERAGE SHARES OUTSTANDING Effect of dilutive securities AVERAGE SHARES OUTSTANDING ASSUMING DILUTION $ 44,294 17,482 26,812 16,427 1,657 8,728 613 856 489 631 9,605 2,239 7,366 15 $ 7,351 $ 1.69 $ 45,998 17,889 28,109 17,218 1,183 9,708 594 483 769 (1,263) 9,325 2,201 7,124 26 $ 7,098 $ 1.62 $ 1.60 4,387 63 4,450 $ 46,854 18,421 28,433 17,310 895 10,228 534 463 602 576 11,477 2,851 8,626 42 $ 8,584 $ 1.94 $ 1.90 4,434 75 4,509 $ 1.67 4,352 53 4,405 THE COCA-COLA COMPANY AND SUBSIDIARIES CONSOLIDATED STATEMENTS OF COMPREHENSIVE INCOME 2015 2014 2013 $ 7,366 $ 7,124 $ 8,626 Year Ended December 31, (In millions) CONSOLIDATED NET INCOME Other comprehensive income: Net foreign currency translation adjustment Net gain (loss) on derivatives Net unrealized gain (loss) on available-for-sale securities Net change in pension and other benefit liabilities TOTAL COMPREHENSIVE INCOME Less: Comprehensive income (loss) attributable to noncontrolling interests TOTAL COMPREHENSIVE INCOME ATTRIBUTABLE TO SHAREOWNERS OF THE COCA-COLA COMPANY 357 (3,959) (2,382) 142 (684) 714 86 (1,039) 2,951 4,774 21 (1,187) 151 (80) 1,066 8,576 39 $ 2,954 $ 4,753 $ 8,537 2015 2014 2013 $ 7,366 1,970 236 73 (122) (137) (374) 929 744 (157) 10,528 $ 7,124 1,976 209 (40) (371) 415 831 $ 8,626 1,977 227 648 (201) 168 (670) 465 234 (932) 10,542 761 149 (439) 10,615 (15,831) 14,079 (2,491) Year Ended December 31, (In millions) OPERATING ACTIVITIES Consolidated net income Depreciation and amortization Stock-based compensation expense Deferred income taxes Equity (income) loss - net of dividends Foreign currency adjustments Significant (gains) losses on sales of assets net Other operating charges Other items Net change in operating assets and liabilities Net cash provided by operating activities INVESTING ACTIVITIES Purchases of investments Proceeds from disposals of investments Acquisitions of businesses, equity method investments and nonmarketable securities Proceeds from disposals of businesses, equity method investments and nonmarketable securities Purchases of property, plant and equipment Proceeds from disposals of property, plant and equipment Other investing activities Net cash provided by (used in) investing activities FINANCING ACTIVITIES Issuances of debt Payments of debt Issuances of stock Purchases of stock for treasury Dividends Other financing activities Net cash provided by (used in) financing activities EFFECT OF EXCHANGE RATE CHANGES ON CASH AND CASH EQUIVALENTS CASH AND CASH EQUIVALENTS Net increase (decrease) during the year Balance at beginning of year Balance at end of year (14,782) 12,791 (353) 872 (2,550) 565 (17,800) 12,986 (389) 148 (2,406) 223 (268) (7,506) (2,553) 85 111 (40) (6,186) (303) (4,214) 40,434 (37,738) 1,245 (3,564) (5,741) 251 (5,113) (878) 41,674 (36,962) 1,532 (4,162) (5,350) (363) (3,631) (934) 43,425 (38,714) 1,328 (4,832) (4,969) 17 (3,745) (611) (1,649) 8,958 $ 7,309 (1,456) 10,414 $ 8,958 1,972 8,442 $ 10,414 THE COCA-COLA COMPANY AND SUBSIDIARIES CONSOLIDATED STATEMENTS OF SHAREOWNERS' EQUITY 2015 2014 2013 4,366 4,402 4,469 (86) (98) (121) 54 4,324 4,366 4,402 1,760 $ 1,760 $ 1,760 62 $ 13,154 532 94 236 Year Ended December 31, (In millions except per share data) EQUITY ATTRIBUTABLE TO SHAREOWNERS OF THE COCA-COLA COMPANY NUMBER OF COMMON SHARES OUTSTANDING Balance at beginning of year Purchases of treasury stock Treasury stock issued to employees related to stock compensation plans Balance at end of year COMMON STOCK CAPITAL SURPLUS Balance at beginning of year Stock issued to employees related to stock compensation plans Tax benefit (charge) from stock compensation plans Stock-based compensation Other activities Balance at end of year REINVESTED EARNINGS Balance at beginning of year Net income attributable to shareowners of The Coca-Cola Company Dividends (per share $1.32, $1.22 and $1.12 in 2015, 2014 and 2013, respectively) Balance at end of year ACCUMULATED OTHER COMPREHENSIVE INCOME (LOSS) Balance at beginning of year Net other comprehensive income (loss) Balance at end of year TREASURY STOCK Balance at beginning of year Stock issued to employees related to stock compensation plans Purchases of treasury stock Balance at end of year TOTAL EQUITY ATTRIBUTABLE TO SHAREOWNERS OF THE COCA-COLA COMPANY 12,276 526 169 209 (26) 13,154 11,379 569 144 227 (43) 12,276 14,016 63,408 7,351 (5,741) 65,018 61,660 7,098 (5,350) 63,408 58,045 8,584 (4,969) 61,660 (5,777) (4,397) (10,174) (3,432) (2,345) (5,777) (3,385) (47) (3,432) (42,225) (39,091) (35,009) 696 891 745 (3,537) (4,025) (4,827) (45,066) (42,225) (39,091) $ 25,554 $ 30,320 $ 33,173
Step by Step Solution
There are 3 Steps involved in it

Get step-by-step solutions from verified subject matter experts