

Question: Here is code so far, but not getting correct visual. Dotted red lines should not be straight. Showed image of what correct visual should look
Here is code so far, but not getting correct visual. Dotted red lines should not be straight. Showed image of what correct visual should look like.
import pandas as pd
import numpy as np
import matplotlib.pyplot as plt
import scipy.stats as stats
fig,axespltsubplots figsize
for i course in enumeratecourses:
datadfcoursedropna
mean,stddata.mean data.std
axaxesi i
stats.probplotdata dist"norm", plotax
axsettitlefcoursereplacegrade', nlendata
axlegendfcoursereplacegrade', nlendata
axaxhlinemean std color'red', linestyle
axaxhlinemean std color'red', linestyle
axsetxlabelTheoretical Quantiles"
axsetylabelOrdered Values"
plttightlayout
pltshow
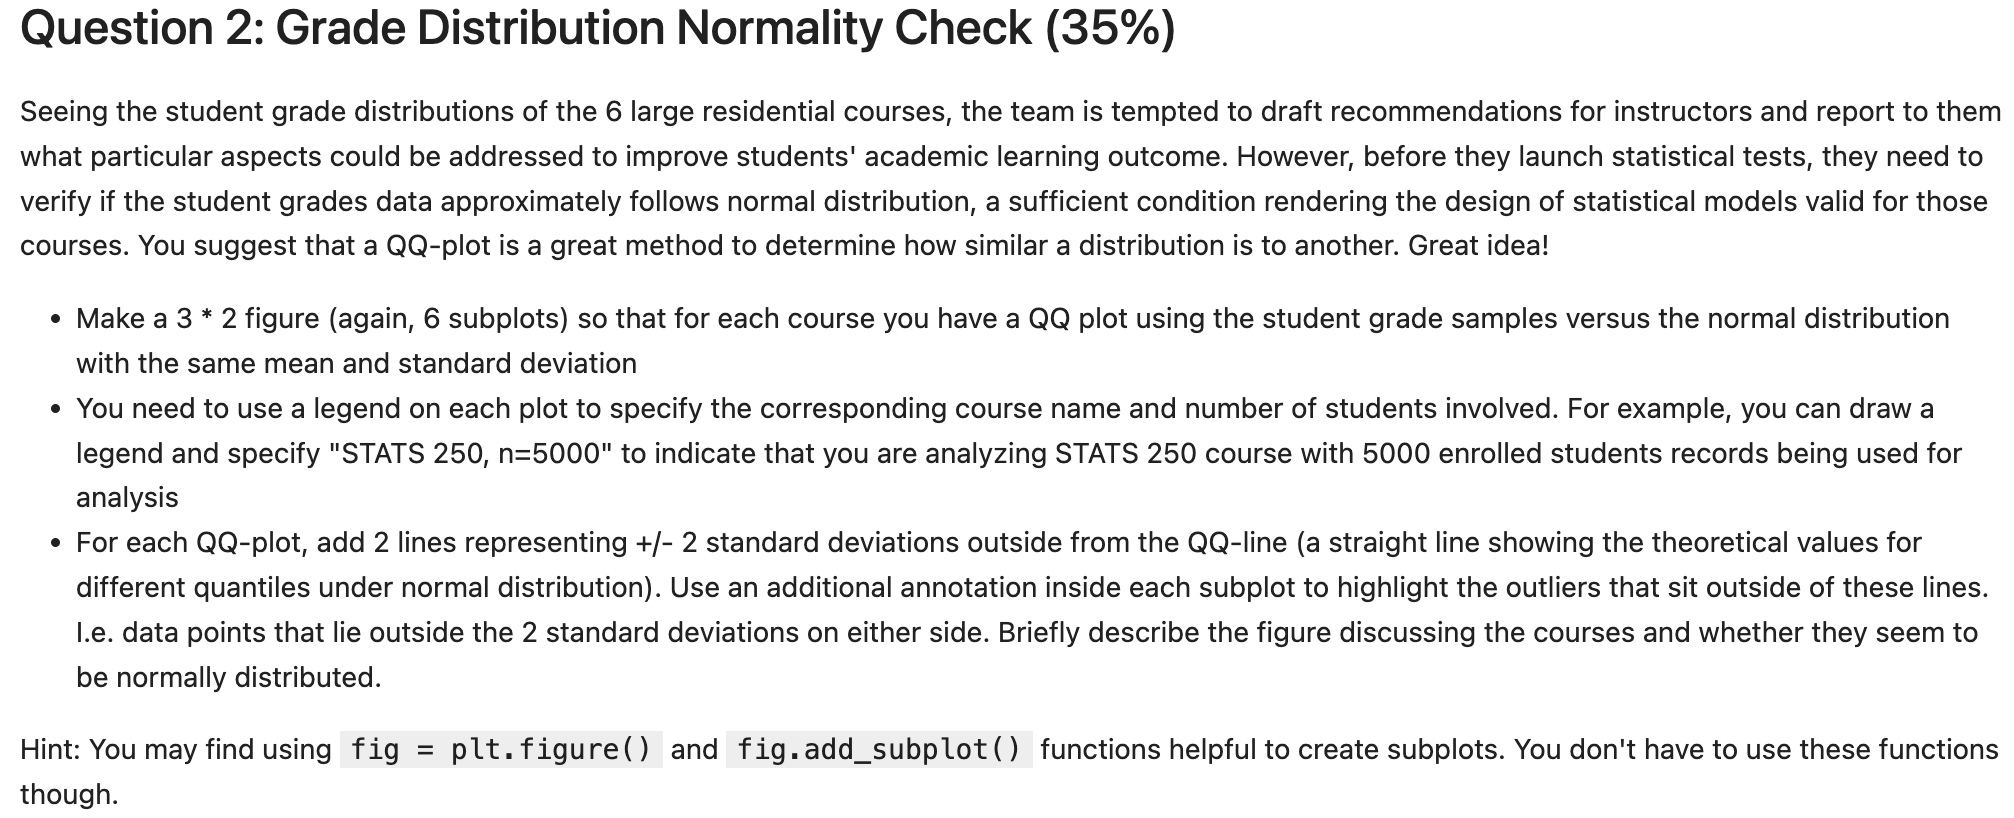
Question : Grade Distribution Normality Check
Seeing the student grade distributions of the large residential courses, the team is tempted to draft recommendations for instructors and report to them what particular aspects could be addressed to improve students' academic learning outcome. However, before they launch statistical tests, they need to verify if the student grades
data approximately follows normal distribution, a sufficient condition rendering the design of statistical models valid for those courses. You suggest that a QQplot is a great method to determine how similar a distribution is to another. Great idea!
Make a figure again subplots so that for each course you have a QQ plot using the student grade samples versus the normal distribution with the same mean and standard deviation
You need to use a legend on each plot to specify the corresponding course name and number of students involved. For example, you can draw a legend and specify "STATS n to indicate that you are analyzing STATS course with enrolled students records being used for analysis
For each QQplot, add lines representing standard deviations outside from the QQline a straight line showing the theoretical values for different quantiles under normal distribution Use an additional annotation inside each subplot to highlight the outliers that sit outside of these lines. I.e data points that lie outside the standard deviations on either side. Briefly describe the figure discussing the courses and whether they seem to be normally distributed.
Hint: You may find using fig pltfigure and fig.addsubplot functions helpful to create subplots. You don't have to use these functions though.
ENGLISH n
English N
Step by Step Solution
There are 3 Steps involved in it
1 Expert Approved Answer
Step: 1 Unlock

Question Has Been Solved by an Expert!
Get step-by-step solutions from verified subject matter experts
Step: 2 Unlock
Step: 3 Unlock