

Question: Here is data we are working with: https://docs.google.com/spreadsheets/d/1DgDcyO-zE6lp-x2Mx3qsntaNx4anM9kXkp5dHrIAOAU/edit?usp=sharing Problem 3: Part a: Recreate the following graphic. The data has fatality data from Virginia. The data
Here is data we are working with: https://docs.google.com/spreadsheets/d/1DgDcyO-zE6lp-x2Mx3qsntaNx4anM9kXkp5dHrIAOAU/edit?usp=sharing
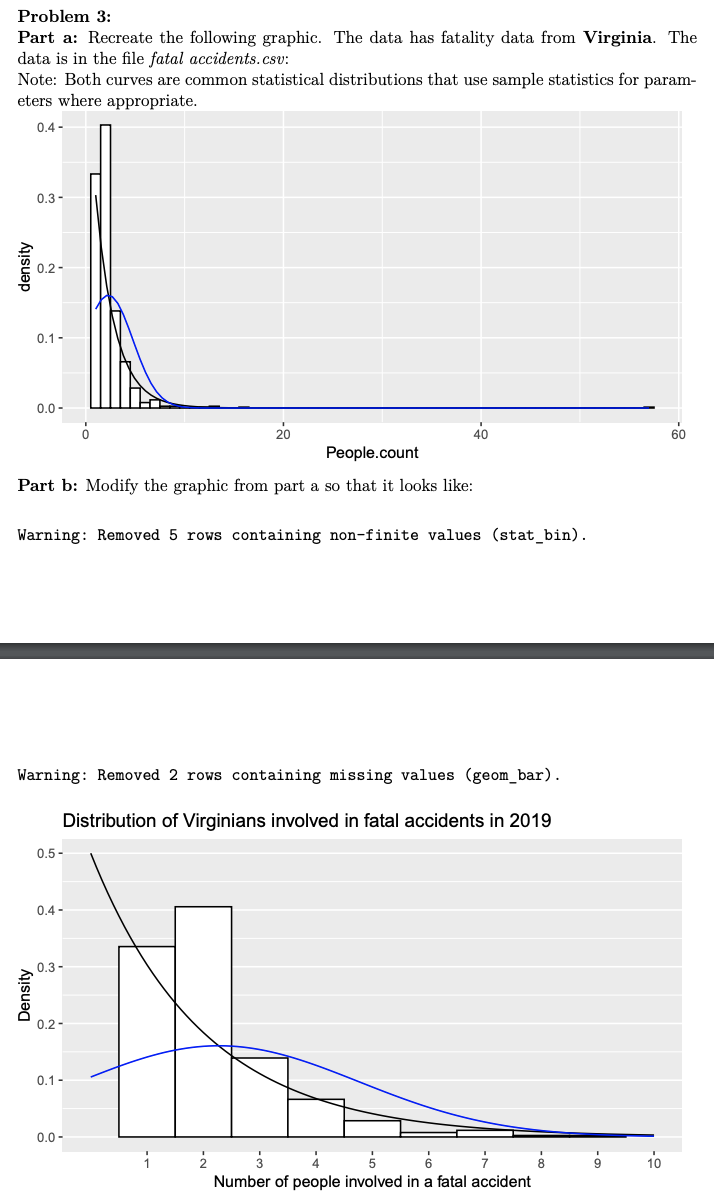
Problem 3: Part a: Recreate the following graphic. The data has fatality data from Virginia. The data is in the file fatal accidents. csv: Note: Both curves are common statistical distributions that use sample statistics for param- eters where appropriate. 0.4 - 0.3 - density 0.2- 0.1 - 0.0- 20 40 60 People.count Part b: Modify the graphic from part a so that it looks like: Warning: Removed 5 rows containing non-finite values (stat_bin). Warning: Removed 2 rows containing missing values (geom_bar). Distribution of Virginians involved in fatal accidents in 2019 0.5 - 0.4 - 0.3 - Density 0.2 . 0.1 - 0.0 - 2 3 4 5 6 7 CO - 00 - 10 Number of people involved in a fatal accident
Step by Step Solution
There are 3 Steps involved in it

Get step-by-step solutions from verified subject matter experts