

Question: Here is data with 3: as the response 1variable. l.- 1 . 39.5 m Make a scatter plot of this data. Which point is an
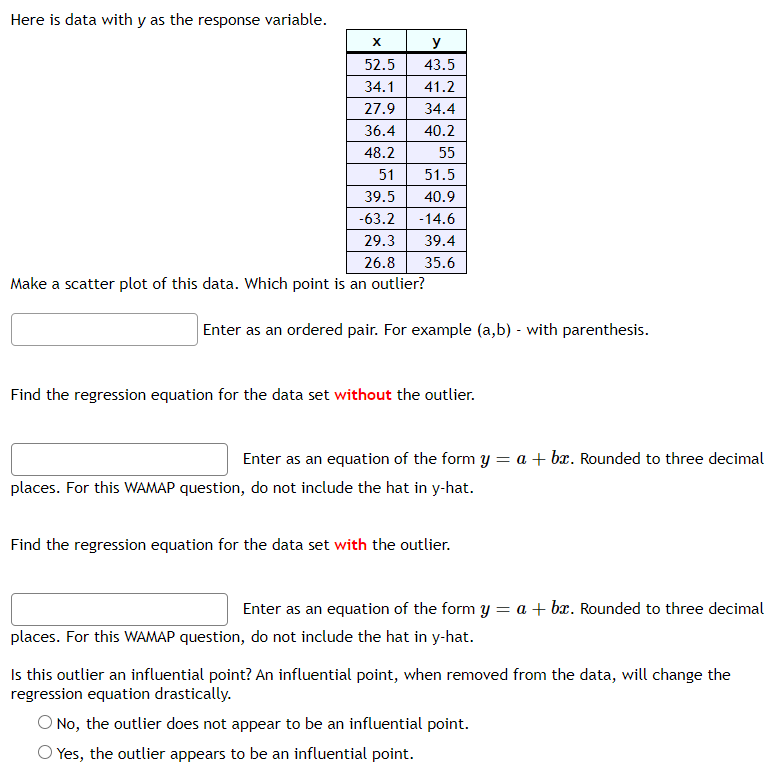
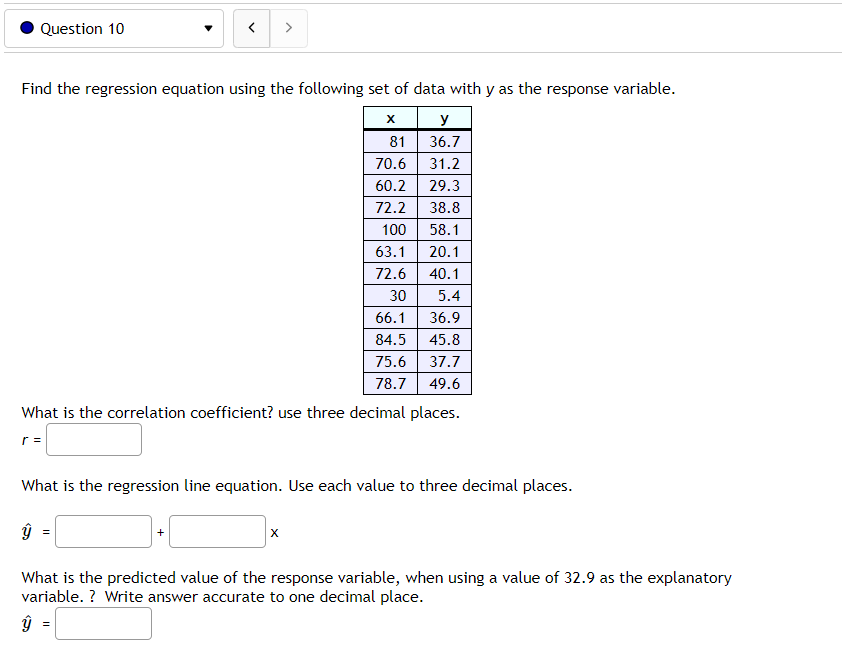
Here is data with 3: as the response 1variable. l.- 1 . 39.5 m Make a scatter plot of this data. Which point is an outlier? - Enter as an ordered pair. For example (a,b] - with parenthesis. Find the regression equation for the data set without the outlier. Enter as an equation of the form '9' = a + film. Rounded to three decimal places. For this WW question, do not include the hat in y-hat. Find the regression equation for the data set with the outlier. Enter as an equation of the form 3; = a. + film. Rounded to three decimal places. For this WAMAP question, do not include the hat in y-hat. Is this outlier an influential point? An influential point, when removed from the data, will change the regression equation drastically. O No, the outlier does not appear to be an influential point. 0 Yes, the outlier appears to be an influential point. Question 10 Find the regression equation using the following set of data with y as the response variable. X y 81 36.7 70.6 31.2 60.2 29.3 72.2 38.8 100 58.1 63.1 20.1 72.6 40.1 30 5.4 66.1 36.9 84.5 45.8 75.6 37.7 78.7 49.6 What is the correlation coefficient? use three decimal places. = J What is the regression line equation. Use each value to three decimal places. y What is the predicted value of the response variable, when using a value of 32.9 as the explanatory variable. ? Write answer accurate to one decimal place. y =
Step by Step Solution
There are 3 Steps involved in it

Get step-by-step solutions from verified subject matter experts