

Question: Here is data with y as the response variable. X y 40.3 48.4 37.2 54.1 33.7 64.3 63.9 -12.5 38 54.5 39.5 51.8 39.5 50.2
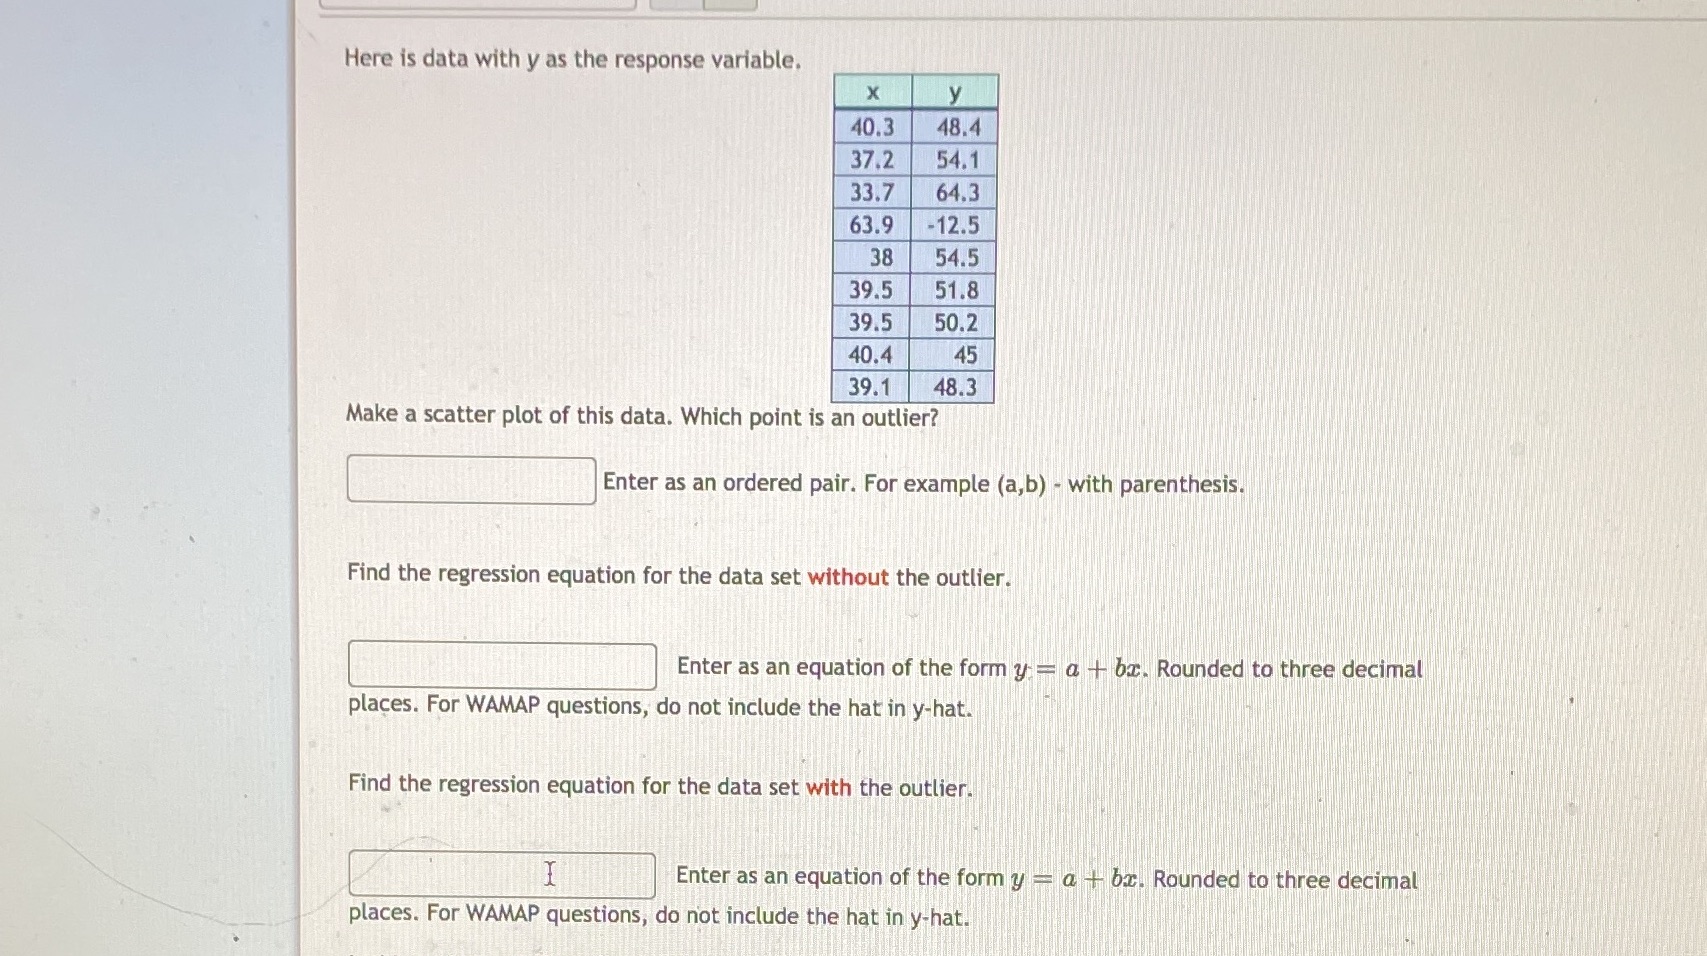
Here is data with y as the response variable. X y 40.3 48.4 37.2 54.1 33.7 64.3 63.9 -12.5 38 54.5 39.5 51.8 39.5 50.2 40.4 45 39.1 48.3 Make a scatter plot of this data. Which point is an outlier? Enter as an ordered pair. For example (a,b) - with parenthesis. Find the regression equation for the data set without the outlier. Enter as an equation of the form y - a + br. Rounded to three decimal places. For WAMAP questions, do not include the hat in y-hat. Find the regression equation for the data set with the outlier. I Enter as an equation of the form y - a + 6 . Rounded to three decimal places. For WAMAP questions, do not include the hat in y-hat
Step by Step Solution
There are 3 Steps involved in it

Get step-by-step solutions from verified subject matter experts