

Question: here is my question 2. - Provide a printout in which you find the- Statistics Here .Descriptive . mean and standard deviation for the 75
here is my question
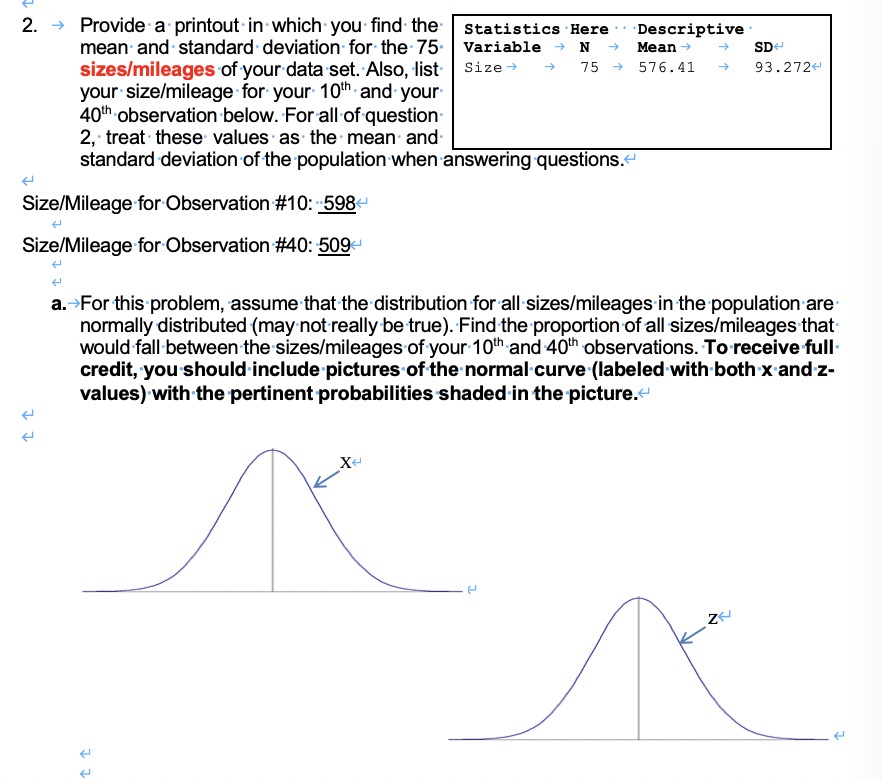
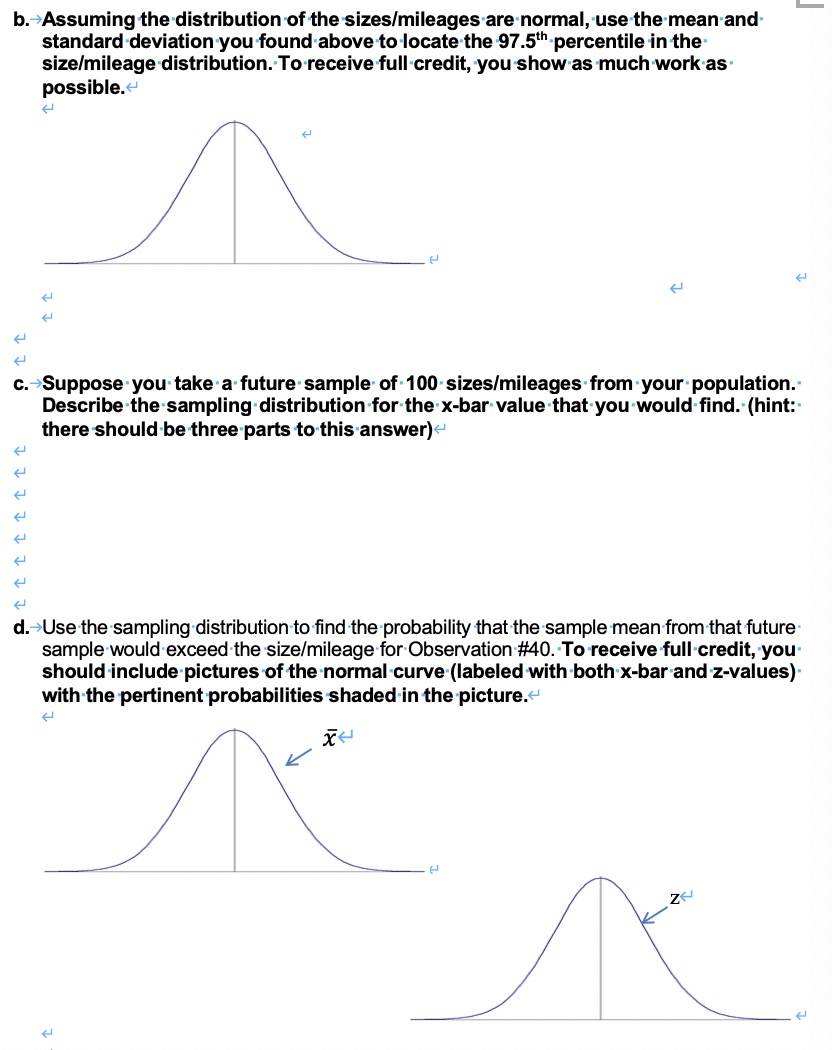
2. - Provide a printout in which you find the- Statistics Here .Descriptive . mean and standard deviation for the 75 Variable - N Mean SD sizes/mileages of your data set. Also, list Size + 75 + 576 .41 93.272- your size/mileage for your 10th and your 40th observation below. For all of question 2, treat these values as the mean and standard deviation of the population when answering questions. Size/Mileage for Observation #10: 598- Size/Mileage for Observation #40: 509- a. -For this problem, assume that the distribution for all sizes/mileages in the population are normally distributed (may not really be true). Find the proportion of all sizes/mileages that would fall between the sizes/mileages of your 10" and 40 observations. To receive full- credit, you should include pictures of the normal curve (labeled with both x and z- values) with the pertinent probabilities shaded in the picture.~ RX tb. Assuming the distribution of the sizes/mileages are normal, use the mean and standard deviation you found above to locate the 97.5 percentile in the size/mileage distribution. To receive full credit, you show as much work as. possible.~ c. Suppose you take a future sample of 100 sizes/mileages from your population. Describe the sampling distribution for the x-bar value that you would find. (hint: there should be three parts to this answer) d. -Use the sampling distribution to find the probability that the sample mean from that future sample would exceed the size/mileage for Observation #40. To receive full credit, you should include pictures of the normal curve (labeled with both x-bar and z-values) with the pertinent probabilities shaded in the picture.~ - ZK
Step by Step Solution
There are 3 Steps involved in it

Get step-by-step solutions from verified subject matter experts