

Question: Here is some data. The least squares estimate from tting a line to the data points are b0 = 6 and b1 = 3. x
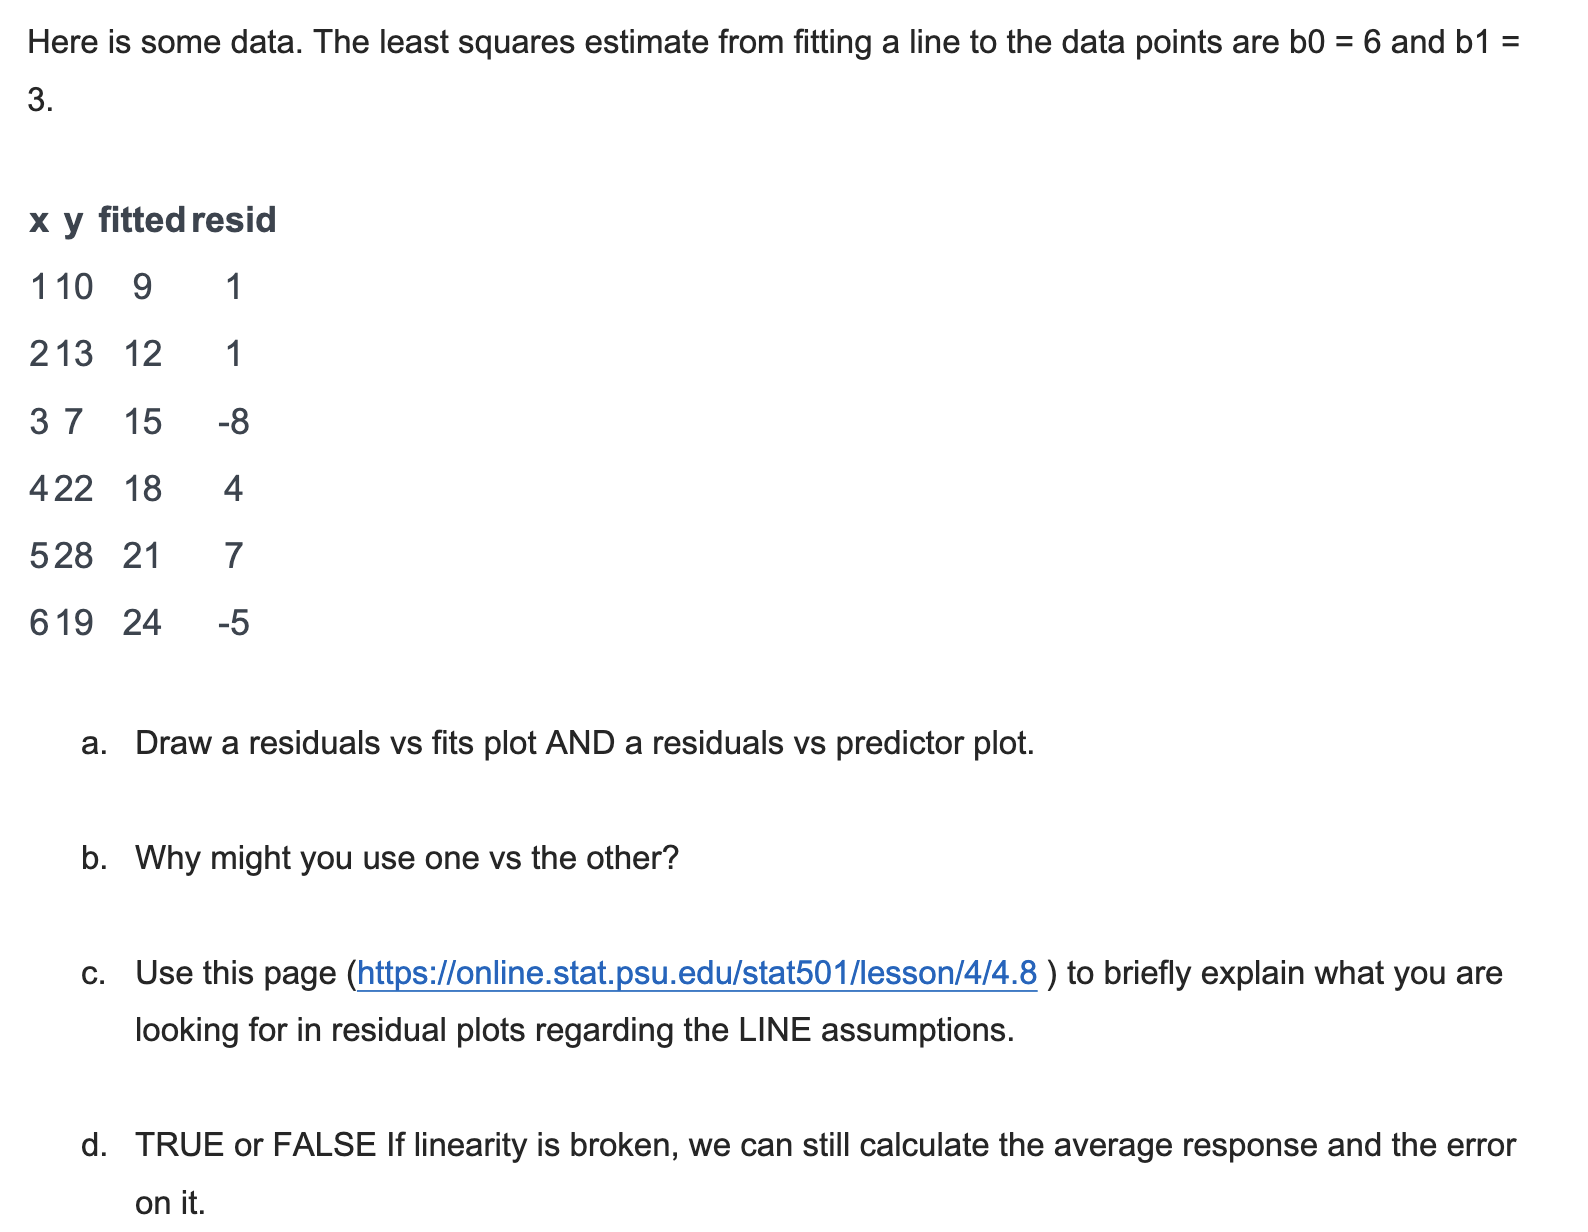

Here is some data. The least squares estimate from tting a line to the data points are b0 = 6 and b1 = 3. x y fitted resid 110 9 1 213 12 1 37 15 -8 422 18 4 528 21 7 619 24 -5 a. Draw a residuals vs ts plot AND a residuals vs predictor plot. b. Why might you use one vs the other? c. Use this page (httpszllonline.stat.psu.edulstat501llessonl4l4.8 ) to briefly explain what you are looking for in residual plots regarding the LINE assumptions. d. TRUE or FALSE If linearity is broken, we can still calculate the average response and the error on it
Step by Step Solution
There are 3 Steps involved in it
1 Expert Approved Answer
Step: 1 Unlock

Question Has Been Solved by an Expert!
Get step-by-step solutions from verified subject matter experts
Step: 2 Unlock
Step: 3 Unlock