

Question: here is the code for full model (Computing) Using the MATLAB files for the full model (i.e. the files used in problem 1), test the
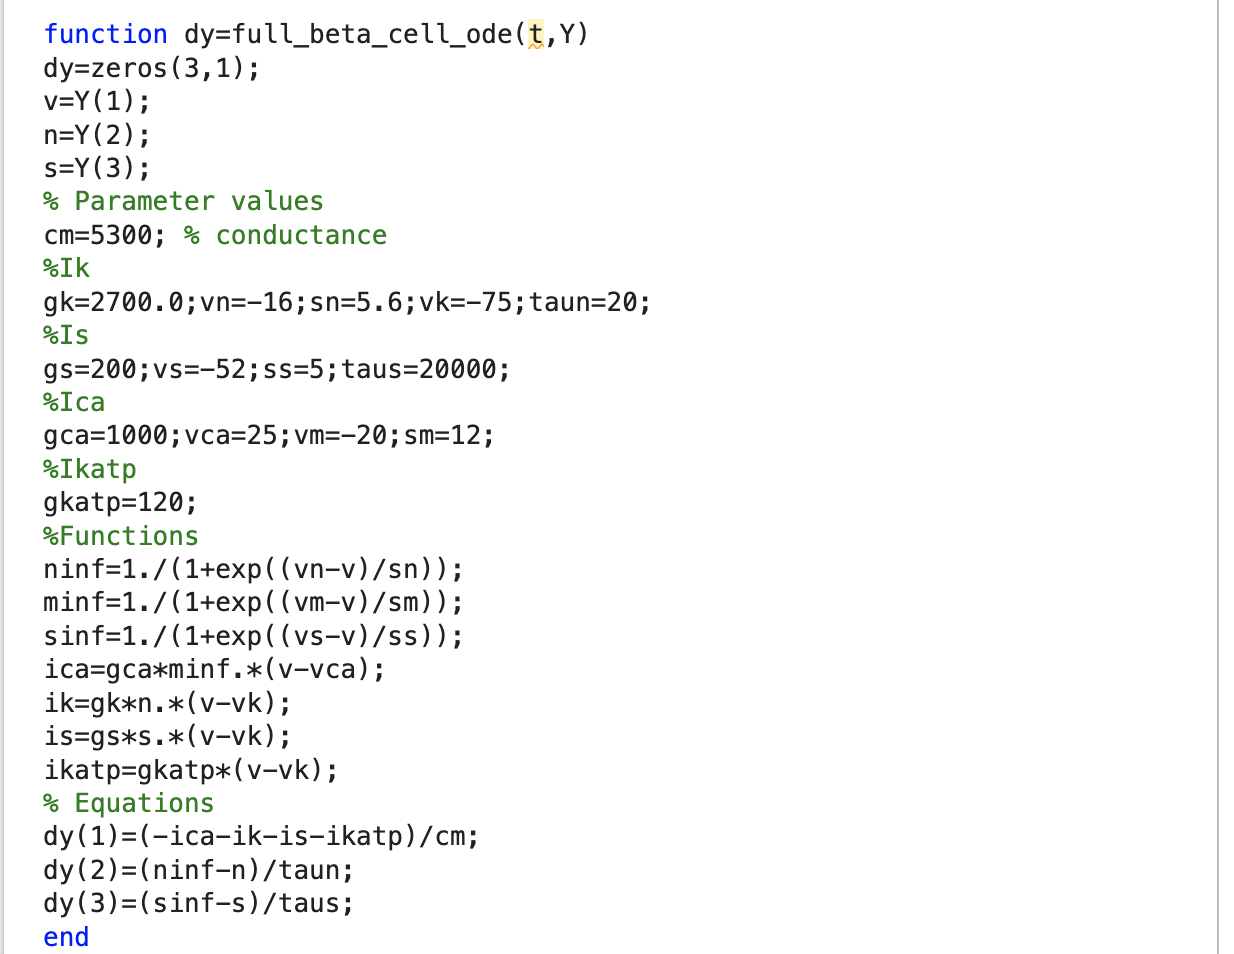
 here is the code for full model
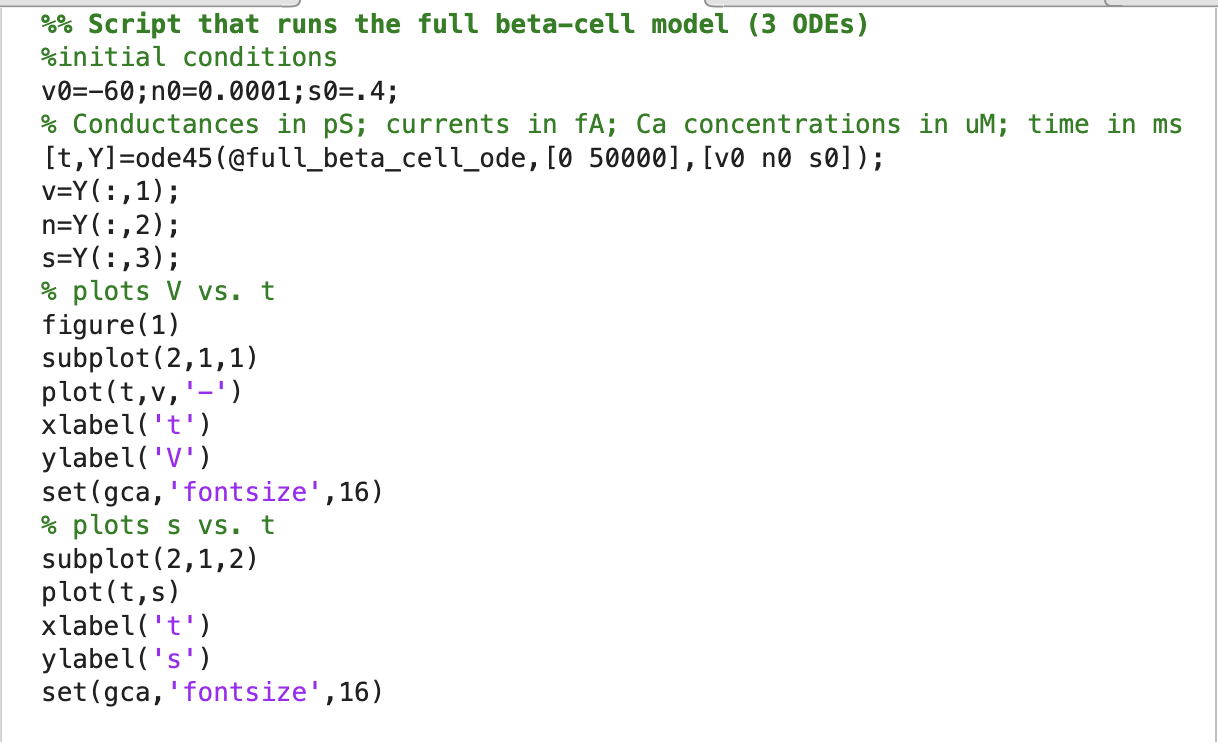
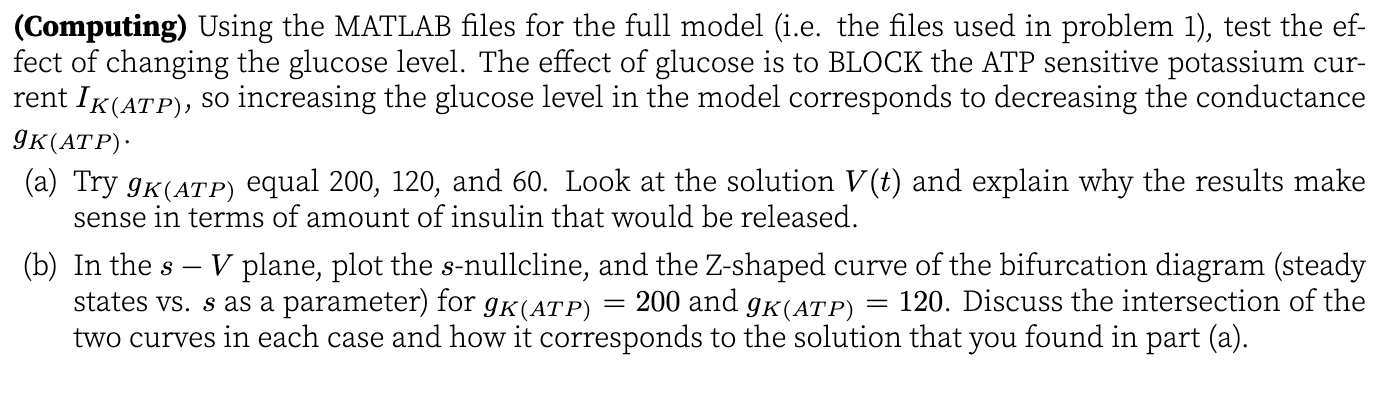
(Computing) Using the MATLAB files for the full model (i.e. the files used in problem 1), test the effect of changing the glucose level. The effect of glucose is to BLOCK the ATP sensitive potassium current IK(ATP), so increasing the glucose level in the model corresponds to decreasing the conductance gK(ATP) (a) Try gK(ATP) equal 200, 120, and 60. Look at the solution V(t) and explain why the results make sense in terms of amount of insulin that would be released. (b) In the sV plane, plot the s-nullcline, and the Z-shaped curve of the bifurcation diagram (steady states vs. s as a parameter) for gK(ATP)=200 and gK(ATP)=120. Discuss the intersection of the two curves in each case and how it corresponds to the solution that you found in part (a)
Step by Step Solution
There are 3 Steps involved in it

Get step-by-step solutions from verified subject matter experts