

Question: here is the data A digital enhanced version 2 For the country of Neverland, Table 2 on page 6 shows the quarterly net corporate dividends,
here is the data
A digital enhanced version
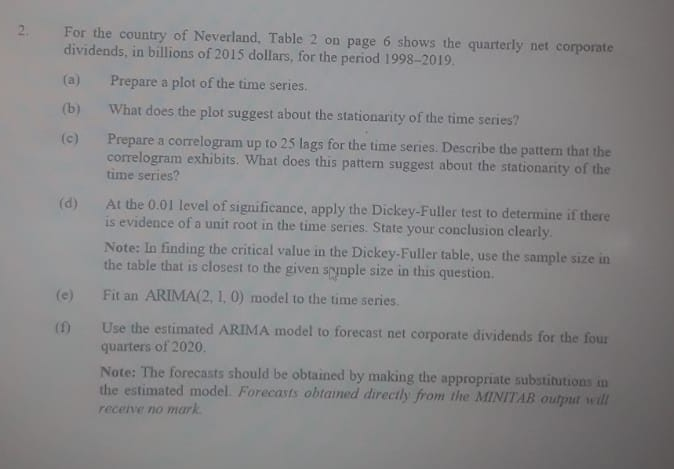
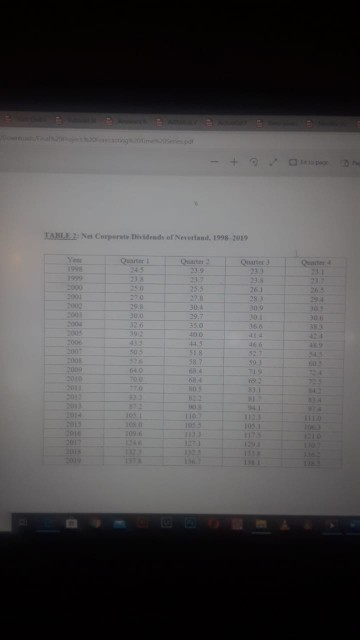
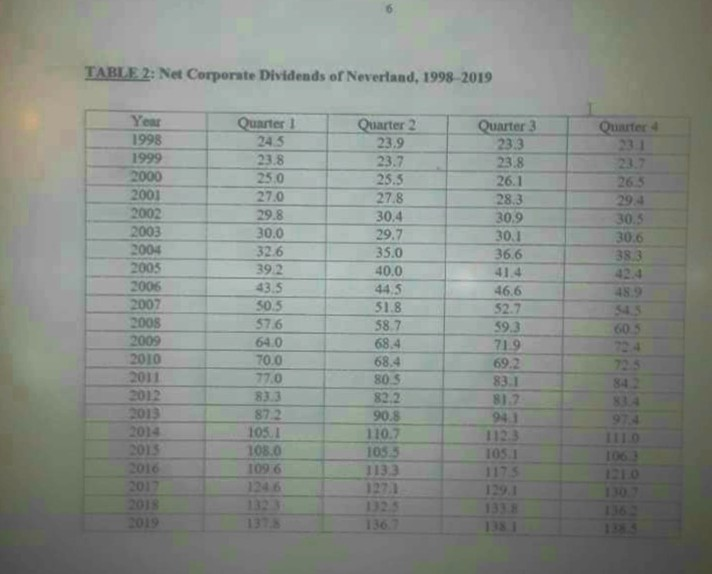
2 For the country of Neverland, Table 2 on page 6 shows the quarterly net corporate dividends, in billions of 2015 dollars, for the period 1998-2019. Prepare a plot of the time series. (b) What does the plot suggest about the stationarity of the time series? (c) Prepare a correlogram up to 25 lags for the time series. Describe the pattem that the correlogram exhibits. What does this pattern suggest about the stationarity of the time series? (d) At the 0.01 level of significance, apply the Dickey-Fuller test to determine if there is evidence of a unit root in the time series. State your conclusion clearly Note: In finding the critical value in the Dickey-Fuller table, use the sample size in the table that is closest to the given sople size in this question (e Fit an ARIMA(2, 1, 0) model to the time series. () Use the estimated ARIMA model to forecast net corporate dividends for the four quarters of 2020. Note: The forecasts should be obtained by making the appropriate substitutions in the estimated model. Forecasts obtamed directly from the MINITAB output will recen no mark TABLE Net Corporate Dvds of Next 1998 2019 LE 28 109 200 200 30.0 32 30. 29. 350 300 TABLE 2: Net Corporate Dividends of Neverland, 1998-2019 Quarter Quarter 3 23.3 23.8 26.1 23.7 265 Year 1998 1999 2000 2001 2002 2003 2004 2003 2006 2007 2005 2009 2010 2011 2012 2013 2014 2013 2016 2017 Quarter 1 24.5 23.8 25.0 27.0 29.8 30.0 32.6 392 43.5 50.5 576 64.0 70.0 77.0 83.3 872 105.1 1080 1096 Quarter 2 23.9 23.7 25.5 27.8 30.4 29.7 35.0 40.0 44,5 51.8 58.7 68.4 68.4 80.5 82.2 90.8 110.7 1055 1133 28.3 30.9 30.1 36.6 41.4 46.6 52.7 59.3 71.9 69.2 83.1 81.2 30.5 30.6 38 3 42.4 48.9 545 605 84 105.1 1175 2 For the country of Neverland, Table 2 on page 6 shows the quarterly net corporate dividends, in billions of 2015 dollars, for the period 1998-2019. Prepare a plot of the time series. (b) What does the plot suggest about the stationarity of the time series? (c) Prepare a correlogram up to 25 lags for the time series. Describe the pattem that the correlogram exhibits. What does this pattern suggest about the stationarity of the time series? (d) At the 0.01 level of significance, apply the Dickey-Fuller test to determine if there is evidence of a unit root in the time series. State your conclusion clearly Note: In finding the critical value in the Dickey-Fuller table, use the sample size in the table that is closest to the given sople size in this question (e Fit an ARIMA(2, 1, 0) model to the time series. () Use the estimated ARIMA model to forecast net corporate dividends for the four quarters of 2020. Note: The forecasts should be obtained by making the appropriate substitutions in the estimated model. Forecasts obtamed directly from the MINITAB output will recen no mark TABLE Net Corporate Dvds of Next 1998 2019 LE 28 109 200 200 30.0 32 30. 29. 350 300 TABLE 2: Net Corporate Dividends of Neverland, 1998-2019 Quarter Quarter 3 23.3 23.8 26.1 23.7 265 Year 1998 1999 2000 2001 2002 2003 2004 2003 2006 2007 2005 2009 2010 2011 2012 2013 2014 2013 2016 2017 Quarter 1 24.5 23.8 25.0 27.0 29.8 30.0 32.6 392 43.5 50.5 576 64.0 70.0 77.0 83.3 872 105.1 1080 1096 Quarter 2 23.9 23.7 25.5 27.8 30.4 29.7 35.0 40.0 44,5 51.8 58.7 68.4 68.4 80.5 82.2 90.8 110.7 1055 1133 28.3 30.9 30.1 36.6 41.4 46.6 52.7 59.3 71.9 69.2 83.1 81.2 30.5 30.6 38 3 42.4 48.9 545 605 84 105.1 1175
Step by Step Solution
There are 3 Steps involved in it

Get step-by-step solutions from verified subject matter experts