

Question: here is the data for the anova problem. I am having problems figuring out the last part which says group 1 vs group 2 etc
here is the data for the anova problem. I am having problems figuring out the last part which says group 1 vs group 2 etc figure out all of the groups
https://1drv.ms/x/s!AqSOmXz6ZXBFkRtcrtAfGOHyvcic?e=CCJjv6
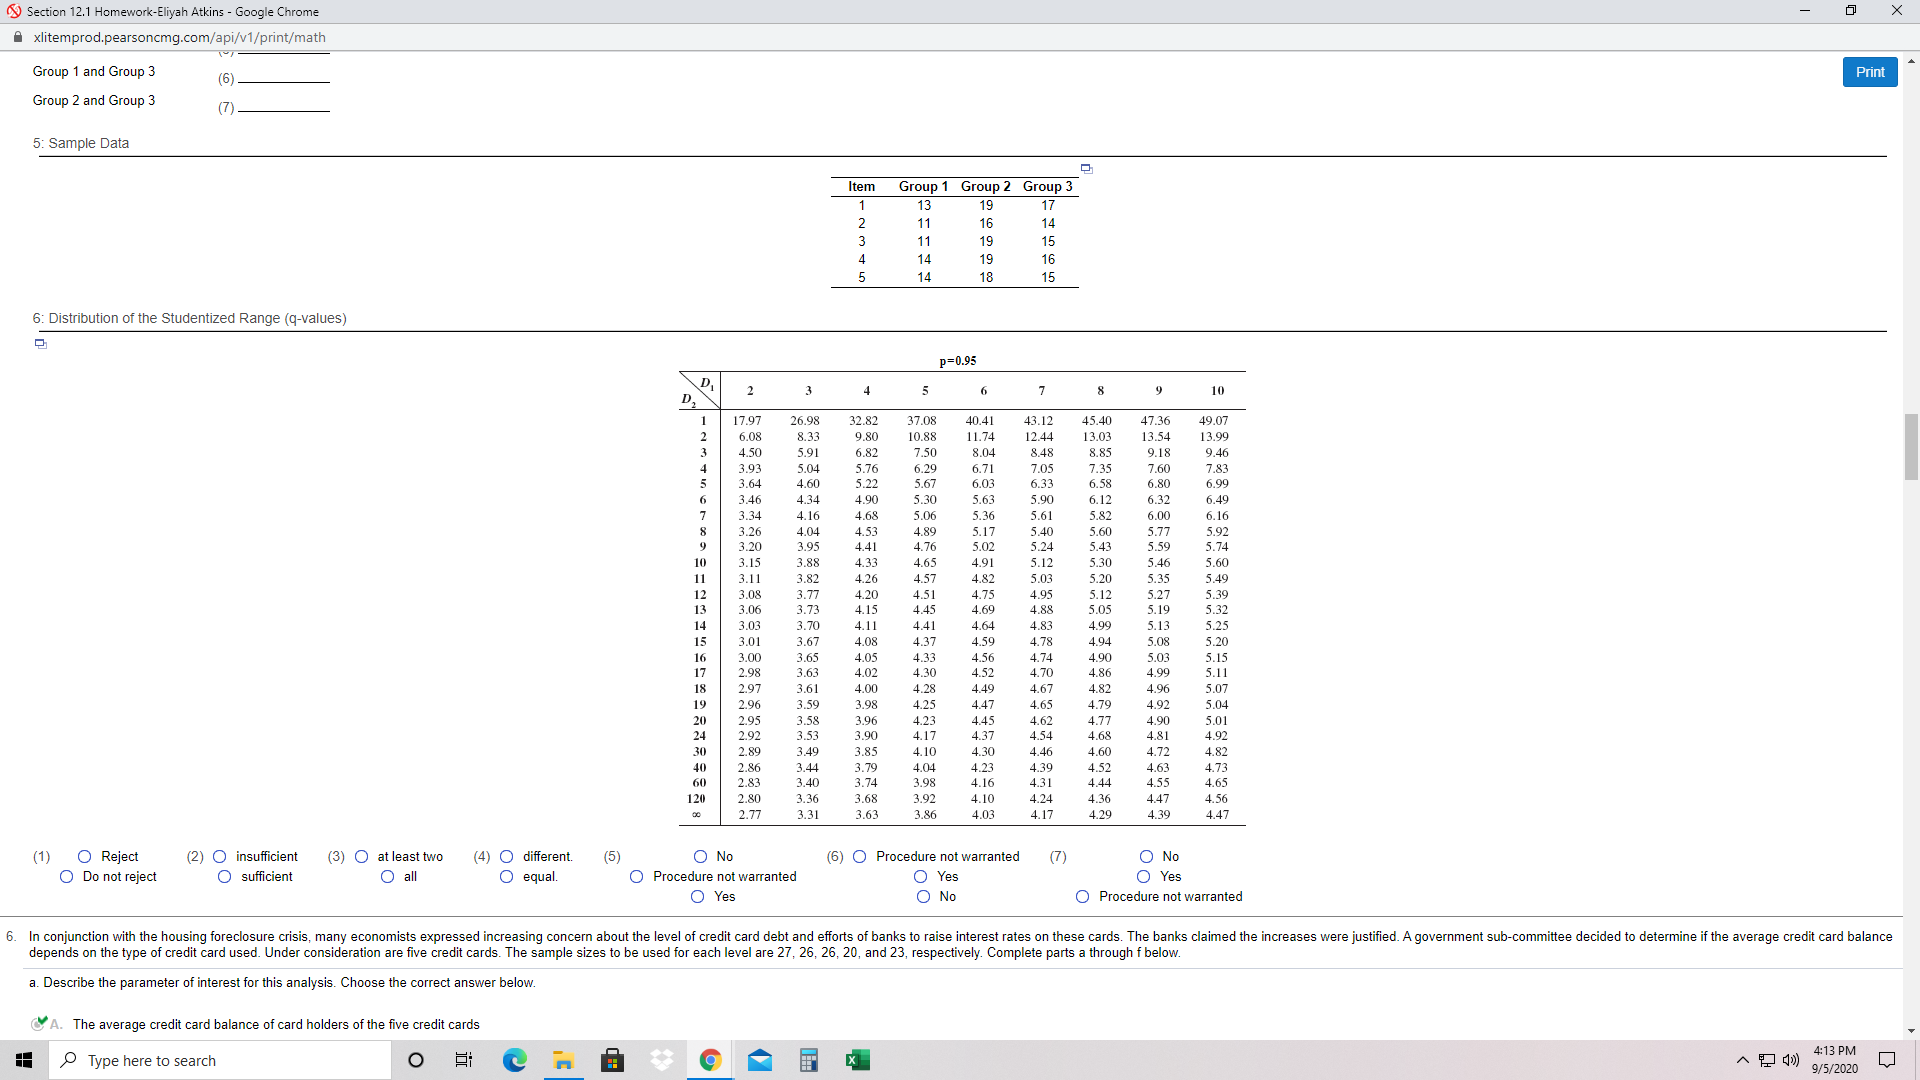
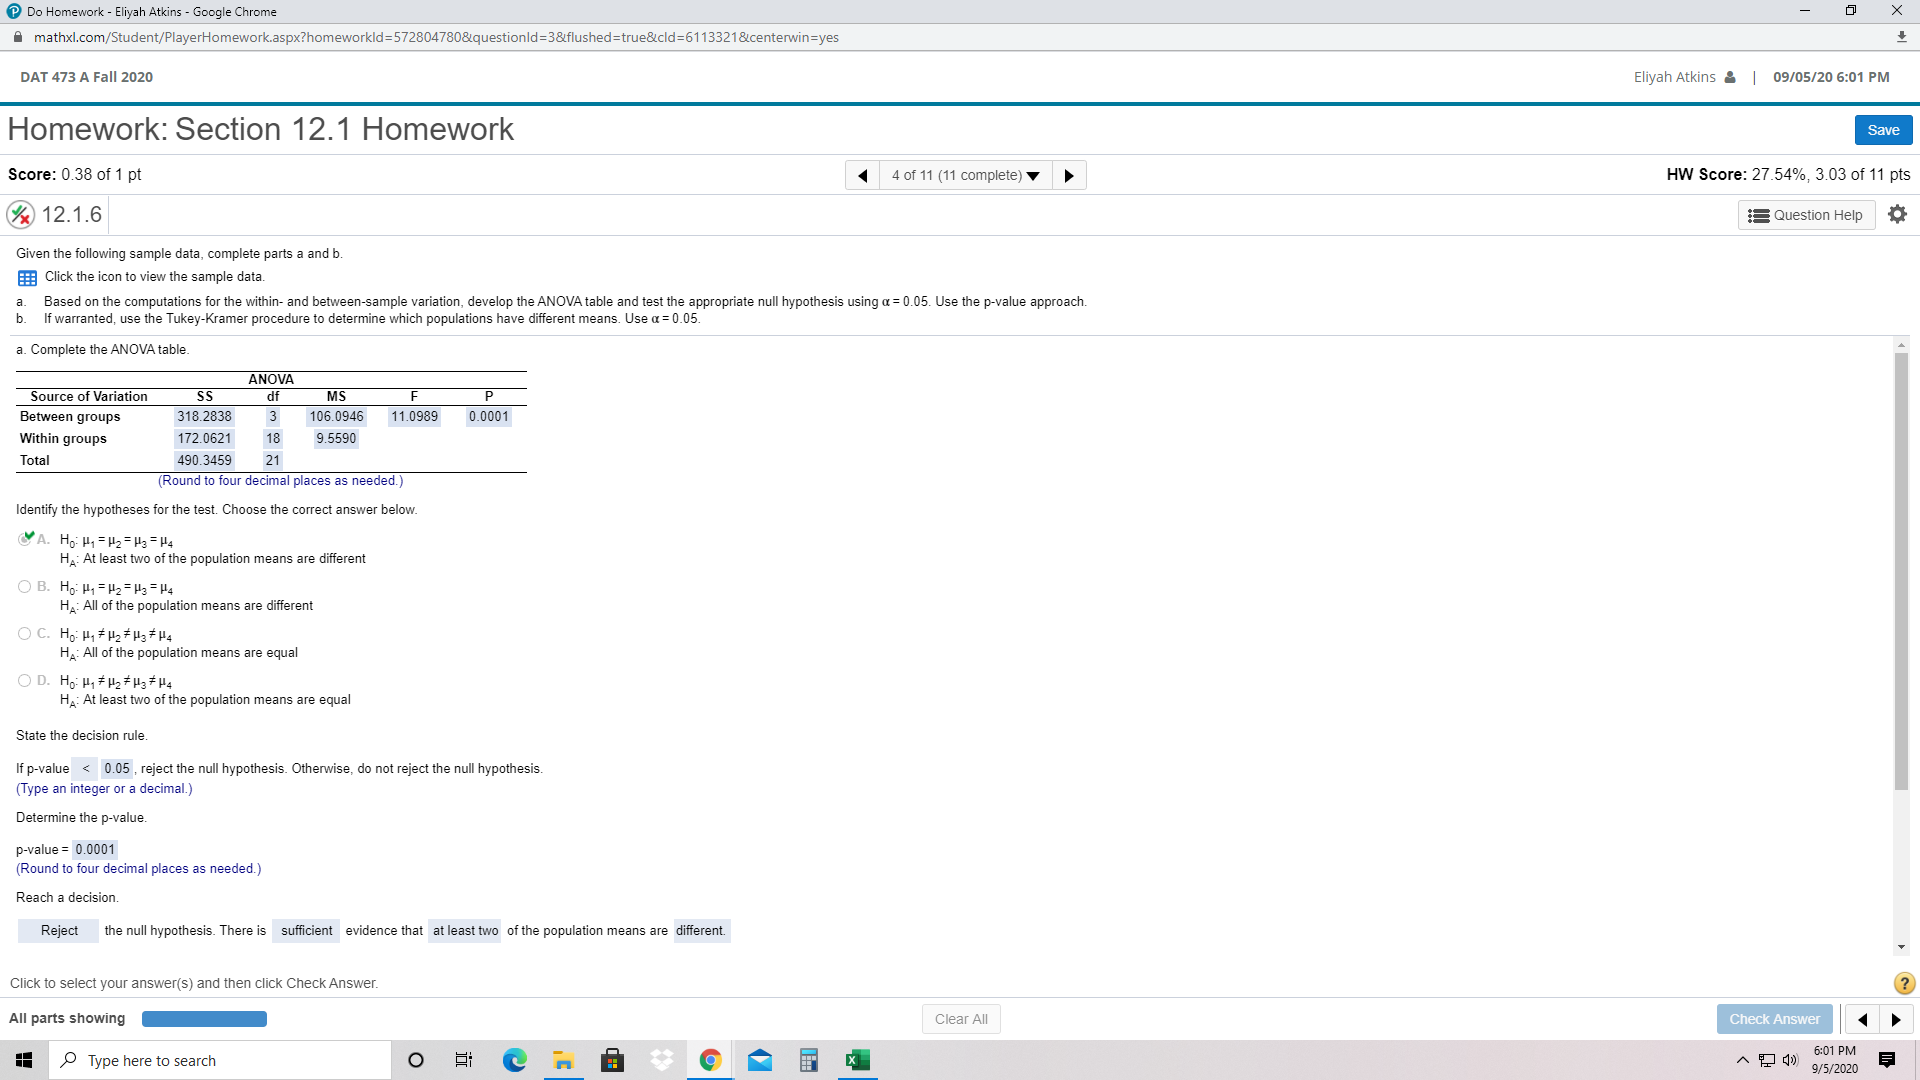
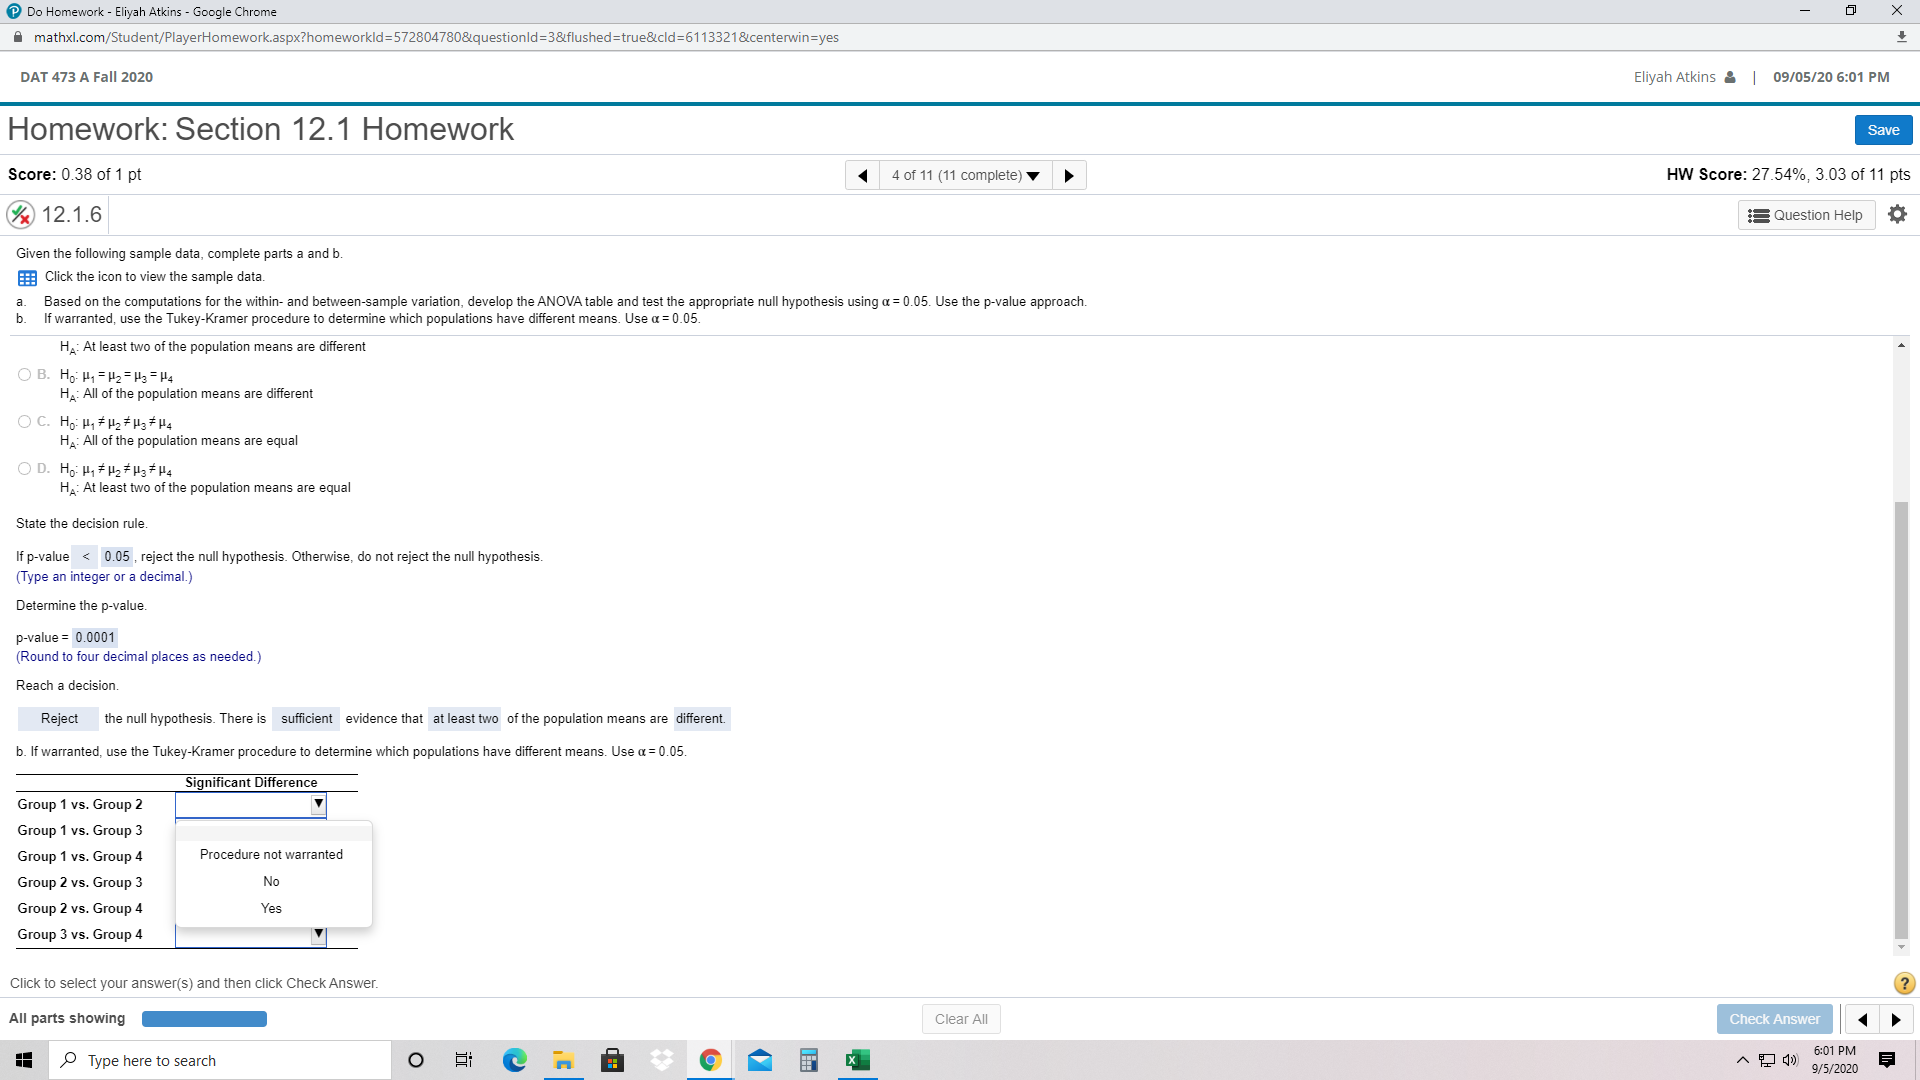

Section 12.1 Homework-Eliyah Atkins - Google Chrome X xlitemprod.pearsoncmg.com/api/v1/print/math Group 1 and Group 3 (6 Print Group 2 and Group 3 6: Sample Data Item Group 1 Group 2 Group 3 JAWN 17 16 14 19 15 14 19 16 14 18 15 6: Distribution of the Studentized Range (q-values) P=0.95 D, 2 3 5 7 8 10 COVanAWN- 17.97 26.98 12.82 7.08 10.41 3.12 45.40 4/.30 6.0 8.33 9.8 0.88 1.74 12.44 13.03 13.99 4.50 5.91 6.82 7.50 3.04 8.48 8.85 9.18 9.46 3.92 5.04 5.76 6.29 5.71 7.05 7.35 7.60 7.83 3.64 4.60 5.22 5.67 5.03 6.33 6.58 6.80 3.46 1 34 4.90 5.30 5.90 6.32 3.34 4.16 4.68 5.06 5.36 5.61 5.82 6.00 6.16 3.26 4.04 4.53 4.89 5.17 5.40 5.60 5.77 5.92 3.20 3.95 4.41 4.76 5.02 5.24 5.43 5.59 5.74 10 3.15 3.88 4.33 4.65 4.91 5.12 5.30 5.46 5,60 3.11 3.82 4.57 5.03 5.20 5.35 5.49 3.08 3.77 4.20 4.51 4.75 4.95 5.12 5.27 5.39 3.06 3.73 4.15 4.45 4.69 4.88 5.05 5.19 5.32 14 3.03 3.70 4.11 4.41 4.64 4.83 4.99 5.13 5.25 3.01 3.67 4.08 4.37 4.59 4.78 4.94 5.08 5.20 3.65 405 4.33 4.74 4.90 5.03 36 6 3.63 4.02 4.30 4.52 4.70 4.86 4.99 5.11 2.97 3.61 4.00 4.28 4.49 4.67 4.82 4.96 5.07 19 2.96 3.59 3.98 4.25 4.47 4.65 4.79 4.92 5.04 20 2.95 3.58 3.96 4.23 4.45 4.62 5.01 24 4.77 4.90 2.92 3.53 3.90 4.17 4.37 4.54 4.81 4.92 30 2.89 3.49 3.85 4.10 4.30 4.46 4.60 4.72 4.82 40 2.86 3.44 3.79 4.04 4 23 4.39 4.52 4.63 4.73 60 2.83 3.40 3.74 3.98 4.16 4.31 4.44 4.55 4.65 120 2.80 3.36 3.68 4.10 4.24 4.36 4.47 4.56 2.77 3.63 3.86 4.03 4.17 4.29 4.39 4.47 (1) O Reject (2) O insufficient (3) O at least two (4) O different. (5) O No (6) O Procedure not warranted (7) O No O Do not reject O sufficient O all O equal O Procedure not warranted O Yes Yes O Yes O No O Procedure not warranted 6. In conjunction with the housing foreclosure crisis, many economists expressed increasing concern about the level of credit card debt and efforts of banks to raise interest rates on these cards. The banks claimed the increases were justified. A government sub-committee decided to determine if the average credit card balance depends on the type of credit card used. Under consideration are five credit cards. The sample sizes to be used for each level are 27, 26, 26, 20, and 23, respectively. Complete parts a through f below. a. Describe the parameter of interest for this analysis. Choose the correct answer below. A. The average credit card balance of card holders of the five credit cards Type here to search ODo Homework - Eliyah Atkins - Google Chrome X mathxl.com/Student/PlayerHomework.aspx?homeworkld=572804780&questionld=3&flushed=true&cld=6113321¢erwin=yes DAT 473 A Fall 2020 Eliyah Atkins & | 09/05/20 6:01 PM Homework: Section 12.1 Homework Save Score: 0.38 of 1 pt 4 of 11 (11 complete) HW Score: 27.54%, 3.03 of 11 pts X 12.1.6 Question Help Given the following sample data, complete parts a and b. Click the icon to view the sample data. Based on the computations for the within- and between-sample variation, develop the ANOVA table and test the appropriate null hypothesis using a = 0.05. Use the p-value approach. If warranted, use the Tukey-Kramer procedure to determine which populations have different means. Use a = 0.05. a. Complete the ANOVA table. ANOVA Source of Variation SS df MS Between groups 318.2838 3 106.0946 11.0989 0.0001 Within groups 172.0621 18 9.5590 Total 490.3459 21 Round to four decimal places as needed.) Identify the hypotheses for the test. Choose the correct answer below. A. Ho. H, = H2 = H3 = H4 HA: At least two of the population means are different O B. Ho- Hq = H2 = H3 = H4 HA: All of the population means are different O C. Ho- Hq # H2 # H3 # H4 HA: All of the population means are equal O D. Ho- Hq # H2 / H3 # H4 HA: At least two of the population means are equal State the decision rule. If p-value
Step by Step Solution
There are 3 Steps involved in it

Get step-by-step solutions from verified subject matter experts