

Question: Here is the data for the following question (I have also uploaded it as a photo if that makes it easier): Quantity sold in the
Here is the data for the following question (I have also uploaded it as a photo if that makes it easier): Quantity sold in the city for that month: Measured in thousands of units
Price: measured in dollars
Average Income in the city: Measured in thousands of dollars
Ads: Average number of ads run in stores for that city during that month.
Price of a substitute product: measured in dollars
Population of the city: measured in thousands of people
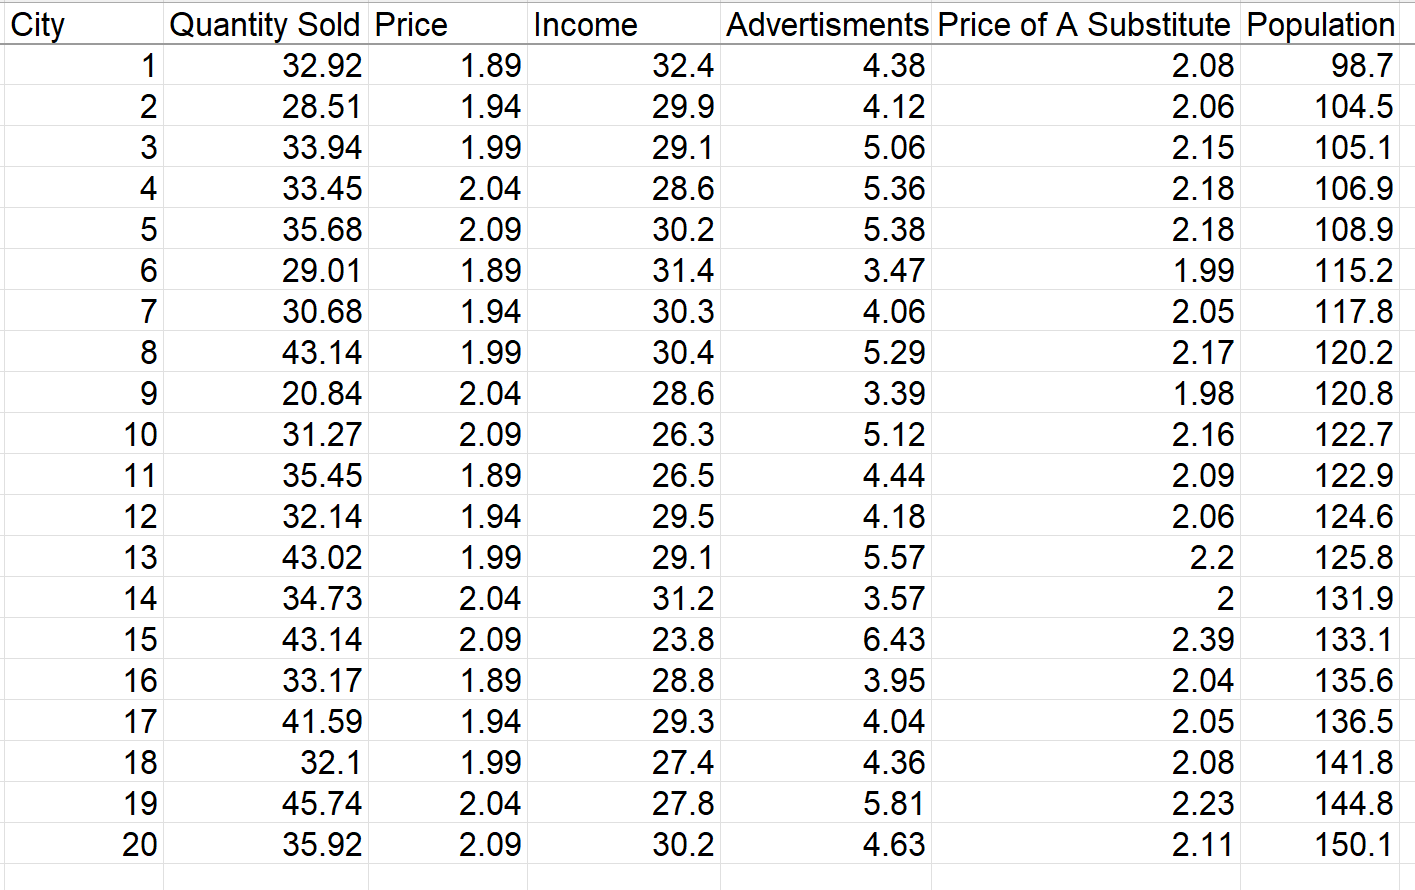
City Quantity Sold Price Income Advertisments Price of A Substitute Population 32.92 1.89 32.4 4.38 2.08 98.7 28.51 1.94 29.9 4.12 2.06 104.5 33.94 1.99 29.1 5.06 2.15 105.1 33.45 2.04 28.6 5.36 2. 18 106.9 35.68 2.09 30.2 5.38 O (0 0 0 ~ ON U A W N- 2. 18 108.9 29.01 1.89 31.4 3.47 1.99 115.2 30.68 1.94 30.3 4.06 2.05 117.8 43.14 1.99 30.4 5.29 2.17 120.2 20.84 2.04 28.6 3.39 1.98 120.8 31.27 2.09 26.3 5.12 2. 16 122.7 11 35.45 1.89 26.5 4.44 2.09 122.9 12 32.14 1.94 29.5 4.18 2.06 124.6 13 43.02 1.99 29.1 5.57 2.2 125.8 14 34.73 2.04 31.2 3.57 2 131.9 15 43. 14 2.09 23.8 6.43 2.39 133.1 16 33.17 1.89 28.8 3.95 2.04 135.6 17 41.59 1.94 29.3 4.04 2.05 136.5 18 32.1 1.99 27.4 4.36 2.08 141.8 19 45.74 2.04 27.8 5.81 2.23 144.8 20 35.92 2.09 30.2 4.63 2.11 150.1
Step by Step Solution
There are 3 Steps involved in it

Get step-by-step solutions from verified subject matter experts