

Question: Here is the data for the past 9 months for actual sales of a particular product: Month Sales, $1,000 monthly, Sales, $1,000 quarterly: January: 275
- Here is the data for the past 9 months for actual sales of a particular product: Month Sales, $1,000 monthly, Sales, $1,000 quarterly:
January: 275 , February: 375 , March: 350 , April: 425 , May: 400 , June: 350 , July: 350 , August: 275 , September: 350 ,
October: November: December:
Develop a forecast for the fourth quarter (Oct-Dec) using a three-quarter, weighted moving average. Weight the most recent quarter 0.5, the second most recent 0.25, and the third 0.25. Solve the problem using quarters, as opposed to forecasting separate months.
2. Calculate the Mean Absolute Deviation (MAD) based on the actual and forecasted demand over the first six months of the year shown in the following table:
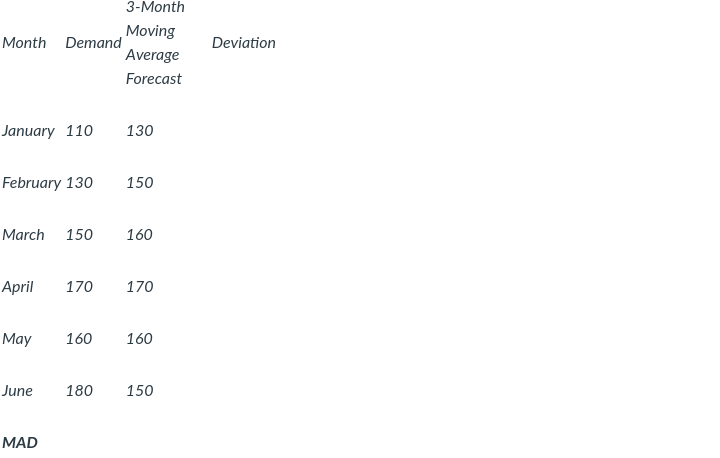
MonthDemandMovingAverageForecast Deviation
Step by Step Solution
There are 3 Steps involved in it
1 Expert Approved Answer
Step: 1 Unlock

Question Has Been Solved by an Expert!
Get step-by-step solutions from verified subject matter experts
Step: 2 Unlock
Step: 3 Unlock