

Question: here is the example please answer Question 1 & 2 and here is the example mentioned Perform allocation of flows to co-products from unallocated data.
here is the example
please answer Question 1 & 2 and here is the example mentioned
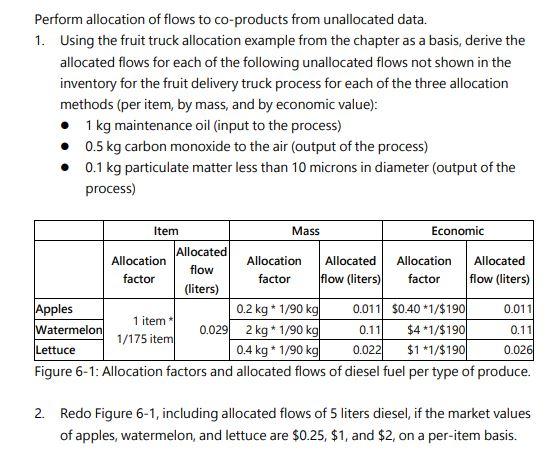
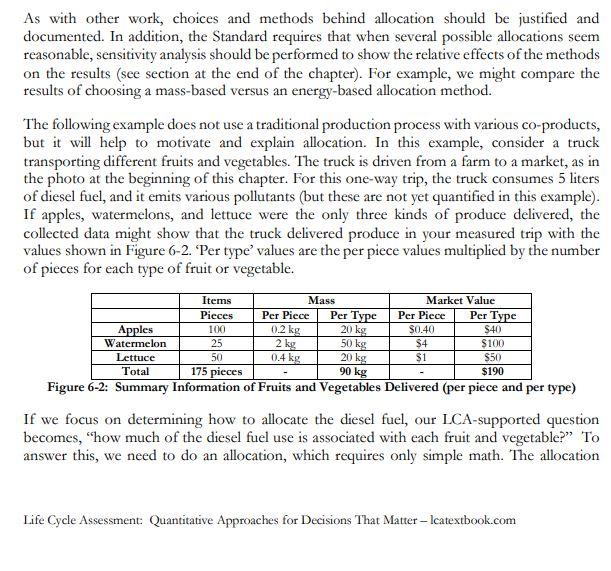
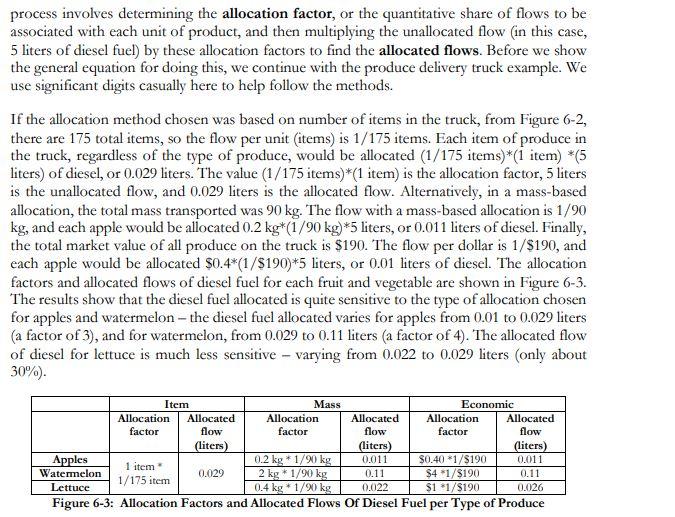
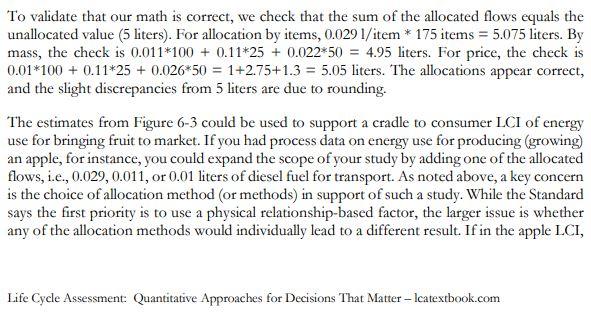
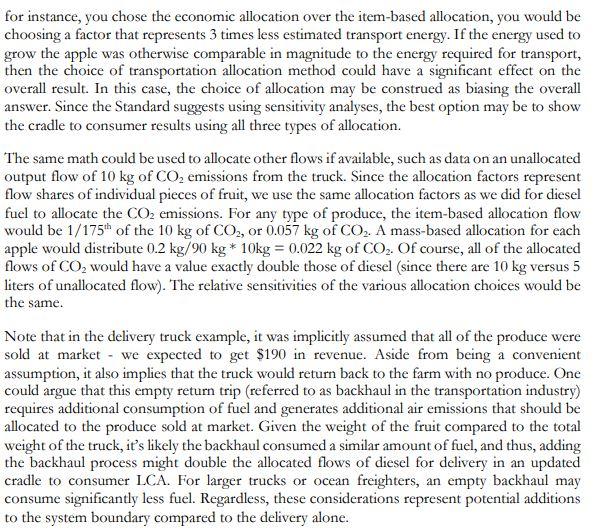
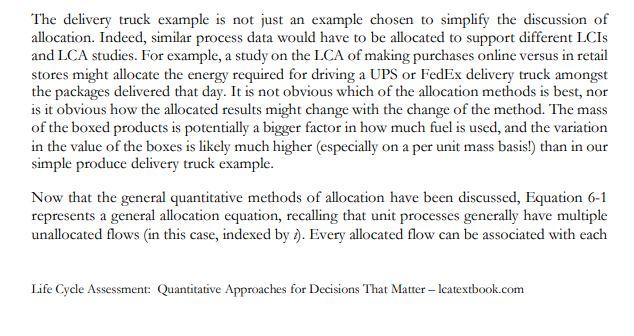
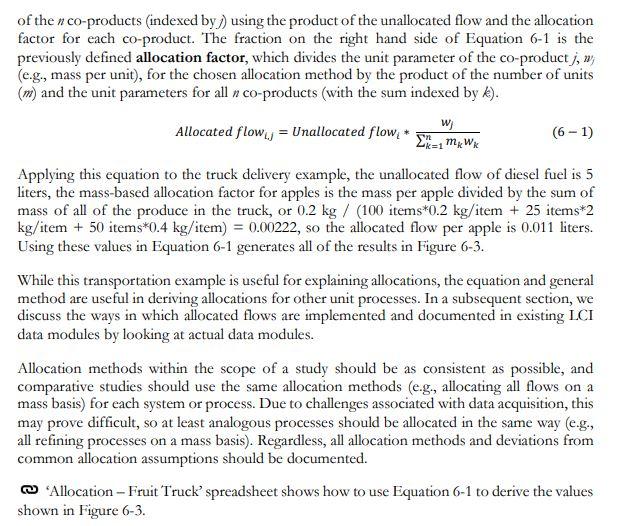
Perform allocation of flows to co-products from unallocated data. 1. Using the fruit truck allocation example from the chapter as a basis, derive the allocated flows for each of the following unallocated flows not shown in the inventory for the fruit delivery truck process for each of the three allocation methods (per item, by mass, and by economic value): 1 kg maintenance oil (input to the process) 0.5 kg carbon monoxide to the air (output of the process) 0.1 kg particulate matter less than 10 microns in diameter (output of the process) Item Mass Economic Allocation Allocated flow Allocation Allocated Allocation factor Allocated flow (liters) factor factor flow (liters) (liters) Apples 0.2 kg * 1/90 kg 0.011 $0.40*1/$190 0.011 1 item 0.029 2 kg * 1/90 kg 0.11 $4*1/$190 0.11 Watermelon Lettuce 1/175 item 0.4 kg * 1/90 kg 0.026 0.022 $1 *1/$190 Figure 6-1: Allocation factors and allocated flows of diesel fuel per type of produce. 2. Redo Figure 6-1, including allocated flows of 5 liters diesel, if the market values of apples, watermelon, and lettuce are $0.25, $1, and $2, on a per-item basis. As with other work, choices and methods behind allocation should be justified and documented. In addition, the Standard requires that when several possible allocations seem reasonable, sensitivity analysis should be performed to show the relative effects of the methods on the results (see section at the end of the chapter). For example, we might compare the results of choosing a mass-based versus an energy-based allocation method. The following example does not use a traditional production process with various co-products, but it will help to motivate and explain allocation. In this example, consider a truck transporting different fruits and vegetables. The truck is driven from a farm to a market, as in the photo at the beginning of this chapter. For this one-way trip, the truck consumes 5 liters of diesel fuel, and it emits various pollutants (but these are not yet quantified in this example). If apples, watermelons, and lettuce were the only three kinds of produce delivered, the collected data might show that the truck delivered produce in your measured trip with the values shown in Figure 6-2. Per type' values are the per piece values multiplied by the number of pieces for each type of fruit or vegetable. Items Mass Pieces Per Piece Per Type 20 kg Per Piece $0.40 Market Value Per Type $40 $100 100 Apples Watermelon 0.2 kg 2 kg 25 50 kg $4 Lettuce 50 0.4 kg 20 kg $1 $50 Total 175 pieces 90 kg $190 Figure 6-2: Summary Information of Fruits and Vegetables Delivered (per piece and per type) If we focus on determining how to allocate the diesel fuel, our LCA-supported question becomes, "how much of the diesel fuel use is associated with each fruit and vegetable?" To answer this, we need to do an allocation, which requires only simple math. The allocation Life Cycle Assessment: Quantitative Approaches for Decisions That Matter-Icatextbook.com process involves determining the allocation factor, or the quantitative share of flows to be associated with each unit of product, and then multiplying the unallocated flow (in this case, 5 liters of diesel fuel) by these allocation factors to find the allocated flows. Before we show the general equation for doing this, we continue with the produce delivery truck example. We use significant digits casually here to help follow the methods. If the allocation method chosen was based on number of items in the truck, from Figure 6-2, there are 175 total items, so the flow per unit (items) is 1/175 items. Each item of produce in the truck, regardless of the type of produce, would be allocated (1/175 items)*(1 item) *(5 liters) of diesel, or 0.029 liters. The value (1/175 items)*(1 item) is the allocation factor, 5 liters is the unallocated flow, and 0.029 liters is the allocated flow. Alternatively, in a mass-based allocation, the total mass transported was 90 kg. The flow with a mass-based allocation is 1/90 kg, and each apple would be allocated 0.2 kg* (1/90 kg) *5 liters, or 0.011 liters of diesel. Finally, the total market value of all produce on the truck is $190. The flow per dollar is 1/$190, and each apple would be allocated $0.4*(1/$190)*5 liters, or 0.01 liters of diesel. The allocation factors and allocated flows of diesel fuel for each fruit and vegetable are shown in Figure 6-3. The results show that the diesel fuel allocated is quite sensitive to the type of allocation chosen for apples and watermelon - the diesel fuel allocated varies for apples from 0.01 to 0.029 liters (a factor of 3), and for watermelon, from 0.029 to 0.11 liters (a factor of 4). The allocated flow of diesel for lettuce is much less sensitive - varying from 0.022 to 0.029 liters (only about 30%). Item Mass Economic Allocation Allocated factor Allocation factor Allocated flow Allocation factor Allocated flow flow (liters) (liters) 0.011 (liters) 0.011 $0.40 *1/$190 Apples Watermelon 1 item 1/175 item 0.029 0.2 kg * 1/90 kg 2 kg * 1/90 kg 0.4 kg * 1/90 kg 0.11 0.11 $4 *1/$190 $1 *1/$190 Lettuce 0.022 0.026 Figure 6-3: Allocation Factors and Allocated Flows Of Diesel Fuel per Type of Produce To validate that our math is correct, we check that the sum of the allocated flows equals the unallocated value (5 liters). For allocation by items, 0.029 1/item* 175 items = 5.075 liters. By mass, the check is 0.011*100+ 0.11*25 +0.022*50= 4.95 liters. For price, the check is 0.01*100+ 0.11*25 + 0.026*50= 1+2.75+1.3= 5.05 liters. The allocations appear correct, and the slight discrepancies from 5 liters are due to rounding. The estimates from Figure 6-3 could be used to support a cradle to consumer LCI of energy use for bringing fruit to market. If you had process data on energy use for producing (growing) an apple, for instance, you could expand the scope of your study by adding one of the allocated flows, i.e., 0.029, 0.011, or 0.01 liters of diesel fuel for transport. As noted above, a key concern is the choice of allocation method (or methods) in support of such a study. While the Standard says the first priority is to use a physical relationship-based factor, the larger issue is whether any of the allocation methods would individually lead to a different result. If in the apple LCI, Life Cycle Assessment: Quantitative Approaches for Decisions That Matter - Icatextbook.com for instance, you chose the economic allocation over the item-based allocation, you would be choosing a factor that represents 3 times less estimated transport energy. If the energy used to grow the apple was otherwise comparable in magnitude to the energy required for transport, then the choice of transportation allocation method could have a significant effect on the overall result. In this case, the choice of allocation may be construed as biasing the overall answer. Since the Standard suggests using sensitivity analyses, the best option may be to show the cradle to consumer results using all three types of allocation. The same math could be used to allocate other flows if available, such as data on an unallocated output flow of 10 kg of CO emissions from the truck. Since the allocation factors represent flow shares of individual pieces of fruit, we use the same allocation factors as we did for diesel fuel to allocate the CO2 emissions. For any type of produce, the item-based allocation flow would be 1/175th of the 10 kg of CO2, or 0.057 kg of CO. A mass-based allocation for each apple would distribute 0.2 kg/90 kg * 10kg = 0.022 kg of CO. Of course, all of the allocated flows of CO would have a value exactly double those of diesel (since there are 10 kg versus 5 liters of unallocated flow). The relative sensitivities of the various allocation choices would be the same. Note that in the delivery truck example, it was implicitly assumed that all of the produce were sold at market - we expected to get $190 in revenue. Aside from being a convenient assumption, it also implies that the truck would return back to the farm with no produce. One could argue that this empty return trip (referred to as backhaul in the transportation industry) requires additional consumption of fuel and generates additional air emissions that should be allocated to the produce sold at market. Given the weight of the fruit compared to the total weight of the truck, it's likely the backhaul consumed a similar amount of fuel, and thus, adding the backhaul process might double the allocated flows of diesel for delivery in an updated cradle to consumer LCA. For larger trucks or ocean freighters, an empty backhaul may consume significantly less fuel. Regardless, these considerations represent potential additions to the system boundary compared to the delivery alone. The delivery truck example is not just an example chosen to simplify the discussion of allocation. Indeed, similar process data would have to be allocated to support different LCIS and LCA studies. For example, a study on the LCA of making purchases online versus in retail stores might allocate the energy required for driving a UPS or FedEx delivery truck amongst the packages delivered that day. It is not obvious which of the allocation methods is best, nor is it obvious how the allocated results might change with the change of the method. The mass of the boxed products is potentially a bigger factor in how much fuel is used, and the variation in the value of the boxes is likely much higher (especially on a per unit mass basis!) than in our simple produce delivery truck example. Now that the general quantitative methods of allocation have been discussed, Equation 6-1 represents a general allocation equation, recalling that unit processes generally have multiple unallocated flows (in this case, indexed by ). Every allocated flow can be associated with each Life Cycle Assessment: Quantitative Approaches for Decisions That Matter - Icatextbook.com of the n co-products (indexed by) using the product of the unallocated flow and the allocation factor for each co-product. The fraction on the right hand side of Equation 6-1 is the previously defined allocation factor, which divides the unit parameter of the co-product j, wj (e.g., mass per unit), for the chosen allocation method by the product of the number of units (m) and the unit parameters for all n co-products (with the sum indexed by k). Wj Allocated flow = Unallocated flow (6-1) yn k=1mk Wk Applying this equation to the truck delivery example, the unallocated flow of diesel fuel is 5 liters, the mass-based allocation factor for apples is the mass per apple divided by the sum of mass of all of the produce in the truck, or 0.2 kg / (100 items*0.2 kg/item + 25 items*2 kg/item + 50 items*0.4 kg/item) = 0.00222, so the allocated flow per apple is 0.011 liters. Using these values in Equation 6-1 generates all of the results in Figure 6-3. While this transportation example is useful for explaining allocations, the equation and general method are useful in deriving allocations for other unit processes. In a subsequent section, we discuss the ways in which allocated flows are implemented and documented in existing LCI data modules by looking at actual data modules. Allocation methods within the scope of a study should be as consistent as possible, and comparative studies should use the same allocation methods (e.g., allocating all flows on a mass basis) for each system or process. Due to challenges associated with data acquisition, this may prove difficult, so at least analogous processes should be allocated in the same way (e.g., all refining processes on a mass basis). Regardless, all allocation methods and deviations from common allocation assumptions should be documented. 'Allocation - Fruit Truck' spreadsheet shows how to use Equation 6-1 to derive the values shown in Figure 6-3. Perform allocation of flows to co-products from unallocated data. 1. Using the fruit truck allocation example from the chapter as a basis, derive the allocated flows for each of the following unallocated flows not shown in the inventory for the fruit delivery truck process for each of the three allocation methods (per item, by mass, and by economic value): 1 kg maintenance oil (input to the process) 0.5 kg carbon monoxide to the air (output of the process) 0.1 kg particulate matter less than 10 microns in diameter (output of the process) Item Mass Economic Allocation Allocated flow Allocation Allocated Allocation factor Allocated flow (liters) factor factor flow (liters) (liters) Apples 0.2 kg * 1/90 kg 0.011 $0.40*1/$190 0.011 1 item 0.029 2 kg * 1/90 kg 0.11 $4*1/$190 0.11 Watermelon Lettuce 1/175 item 0.4 kg * 1/90 kg 0.026 0.022 $1 *1/$190 Figure 6-1: Allocation factors and allocated flows of diesel fuel per type of produce. 2. Redo Figure 6-1, including allocated flows of 5 liters diesel, if the market values of apples, watermelon, and lettuce are $0.25, $1, and $2, on a per-item basis. As with other work, choices and methods behind allocation should be justified and documented. In addition, the Standard requires that when several possible allocations seem reasonable, sensitivity analysis should be performed to show the relative effects of the methods on the results (see section at the end of the chapter). For example, we might compare the results of choosing a mass-based versus an energy-based allocation method. The following example does not use a traditional production process with various co-products, but it will help to motivate and explain allocation. In this example, consider a truck transporting different fruits and vegetables. The truck is driven from a farm to a market, as in the photo at the beginning of this chapter. For this one-way trip, the truck consumes 5 liters of diesel fuel, and it emits various pollutants (but these are not yet quantified in this example). If apples, watermelons, and lettuce were the only three kinds of produce delivered, the collected data might show that the truck delivered produce in your measured trip with the values shown in Figure 6-2. Per type' values are the per piece values multiplied by the number of pieces for each type of fruit or vegetable. Items Mass Pieces Per Piece Per Type 20 kg Per Piece $0.40 Market Value Per Type $40 $100 100 Apples Watermelon 0.2 kg 2 kg 25 50 kg $4 Lettuce 50 0.4 kg 20 kg $1 $50 Total 175 pieces 90 kg $190 Figure 6-2: Summary Information of Fruits and Vegetables Delivered (per piece and per type) If we focus on determining how to allocate the diesel fuel, our LCA-supported question becomes, "how much of the diesel fuel use is associated with each fruit and vegetable?" To answer this, we need to do an allocation, which requires only simple math. The allocation Life Cycle Assessment: Quantitative Approaches for Decisions That Matter-Icatextbook.com process involves determining the allocation factor, or the quantitative share of flows to be associated with each unit of product, and then multiplying the unallocated flow (in this case, 5 liters of diesel fuel) by these allocation factors to find the allocated flows. Before we show the general equation for doing this, we continue with the produce delivery truck example. We use significant digits casually here to help follow the methods. If the allocation method chosen was based on number of items in the truck, from Figure 6-2, there are 175 total items, so the flow per unit (items) is 1/175 items. Each item of produce in the truck, regardless of the type of produce, would be allocated (1/175 items)*(1 item) *(5 liters) of diesel, or 0.029 liters. The value (1/175 items)*(1 item) is the allocation factor, 5 liters is the unallocated flow, and 0.029 liters is the allocated flow. Alternatively, in a mass-based allocation, the total mass transported was 90 kg. The flow with a mass-based allocation is 1/90 kg, and each apple would be allocated 0.2 kg* (1/90 kg) *5 liters, or 0.011 liters of diesel. Finally, the total market value of all produce on the truck is $190. The flow per dollar is 1/$190, and each apple would be allocated $0.4*(1/$190)*5 liters, or 0.01 liters of diesel. The allocation factors and allocated flows of diesel fuel for each fruit and vegetable are shown in Figure 6-3. The results show that the diesel fuel allocated is quite sensitive to the type of allocation chosen for apples and watermelon - the diesel fuel allocated varies for apples from 0.01 to 0.029 liters (a factor of 3), and for watermelon, from 0.029 to 0.11 liters (a factor of 4). The allocated flow of diesel for lettuce is much less sensitive - varying from 0.022 to 0.029 liters (only about 30%). Item Mass Economic Allocation Allocated factor Allocation factor Allocated flow Allocation factor Allocated flow flow (liters) (liters) 0.011 (liters) 0.011 $0.40 *1/$190 Apples Watermelon 1 item 1/175 item 0.029 0.2 kg * 1/90 kg 2 kg * 1/90 kg 0.4 kg * 1/90 kg 0.11 0.11 $4 *1/$190 $1 *1/$190 Lettuce 0.022 0.026 Figure 6-3: Allocation Factors and Allocated Flows Of Diesel Fuel per Type of Produce To validate that our math is correct, we check that the sum of the allocated flows equals the unallocated value (5 liters). For allocation by items, 0.029 1/item* 175 items = 5.075 liters. By mass, the check is 0.011*100+ 0.11*25 +0.022*50= 4.95 liters. For price, the check is 0.01*100+ 0.11*25 + 0.026*50= 1+2.75+1.3= 5.05 liters. The allocations appear correct, and the slight discrepancies from 5 liters are due to rounding. The estimates from Figure 6-3 could be used to support a cradle to consumer LCI of energy use for bringing fruit to market. If you had process data on energy use for producing (growing) an apple, for instance, you could expand the scope of your study by adding one of the allocated flows, i.e., 0.029, 0.011, or 0.01 liters of diesel fuel for transport. As noted above, a key concern is the choice of allocation method (or methods) in support of such a study. While the Standard says the first priority is to use a physical relationship-based factor, the larger issue is whether any of the allocation methods would individually lead to a different result. If in the apple LCI, Life Cycle Assessment: Quantitative Approaches for Decisions That Matter - Icatextbook.com for instance, you chose the economic allocation over the item-based allocation, you would be choosing a factor that represents 3 times less estimated transport energy. If the energy used to grow the apple was otherwise comparable in magnitude to the energy required for transport, then the choice of transportation allocation method could have a significant effect on the overall result. In this case, the choice of allocation may be construed as biasing the overall answer. Since the Standard suggests using sensitivity analyses, the best option may be to show the cradle to consumer results using all three types of allocation. The same math could be used to allocate other flows if available, such as data on an unallocated output flow of 10 kg of CO emissions from the truck. Since the allocation factors represent flow shares of individual pieces of fruit, we use the same allocation factors as we did for diesel fuel to allocate the CO2 emissions. For any type of produce, the item-based allocation flow would be 1/175th of the 10 kg of CO2, or 0.057 kg of CO. A mass-based allocation for each apple would distribute 0.2 kg/90 kg * 10kg = 0.022 kg of CO. Of course, all of the allocated flows of CO would have a value exactly double those of diesel (since there are 10 kg versus 5 liters of unallocated flow). The relative sensitivities of the various allocation choices would be the same. Note that in the delivery truck example, it was implicitly assumed that all of the produce were sold at market - we expected to get $190 in revenue. Aside from being a convenient assumption, it also implies that the truck would return back to the farm with no produce. One could argue that this empty return trip (referred to as backhaul in the transportation industry) requires additional consumption of fuel and generates additional air emissions that should be allocated to the produce sold at market. Given the weight of the fruit compared to the total weight of the truck, it's likely the backhaul consumed a similar amount of fuel, and thus, adding the backhaul process might double the allocated flows of diesel for delivery in an updated cradle to consumer LCA. For larger trucks or ocean freighters, an empty backhaul may consume significantly less fuel. Regardless, these considerations represent potential additions to the system boundary compared to the delivery alone. The delivery truck example is not just an example chosen to simplify the discussion of allocation. Indeed, similar process data would have to be allocated to support different LCIS and LCA studies. For example, a study on the LCA of making purchases online versus in retail stores might allocate the energy required for driving a UPS or FedEx delivery truck amongst the packages delivered that day. It is not obvious which of the allocation methods is best, nor is it obvious how the allocated results might change with the change of the method. The mass of the boxed products is potentially a bigger factor in how much fuel is used, and the variation in the value of the boxes is likely much higher (especially on a per unit mass basis!) than in our simple produce delivery truck example. Now that the general quantitative methods of allocation have been discussed, Equation 6-1 represents a general allocation equation, recalling that unit processes generally have multiple unallocated flows (in this case, indexed by ). Every allocated flow can be associated with each Life Cycle Assessment: Quantitative Approaches for Decisions That Matter - Icatextbook.com of the n co-products (indexed by) using the product of the unallocated flow and the allocation factor for each co-product. The fraction on the right hand side of Equation 6-1 is the previously defined allocation factor, which divides the unit parameter of the co-product j, wj (e.g., mass per unit), for the chosen allocation method by the product of the number of units (m) and the unit parameters for all n co-products (with the sum indexed by k). Wj Allocated flow = Unallocated flow (6-1) yn k=1mk Wk Applying this equation to the truck delivery example, the unallocated flow of diesel fuel is 5 liters, the mass-based allocation factor for apples is the mass per apple divided by the sum of mass of all of the produce in the truck, or 0.2 kg / (100 items*0.2 kg/item + 25 items*2 kg/item + 50 items*0.4 kg/item) = 0.00222, so the allocated flow per apple is 0.011 liters. Using these values in Equation 6-1 generates all of the results in Figure 6-3. While this transportation example is useful for explaining allocations, the equation and general method are useful in deriving allocations for other unit processes. In a subsequent section, we discuss the ways in which allocated flows are implemented and documented in existing LCI data modules by looking at actual data modules. Allocation methods within the scope of a study should be as consistent as possible, and comparative studies should use the same allocation methods (e.g., allocating all flows on a mass basis) for each system or process. Due to challenges associated with data acquisition, this may prove difficult, so at least analogous processes should be allocated in the same way (e.g., all refining processes on a mass basis). Regardless, all allocation methods and deviations from common allocation assumptions should be documented. 'Allocation - Fruit Truck' spreadsheet shows how to use Equation 6-1 to derive the values shown in Figure 6-3Step by Step Solution
There are 3 Steps involved in it
1 Expert Approved Answer
Step: 1 Unlock

Question Has Been Solved by an Expert!
Get step-by-step solutions from verified subject matter experts
Step: 2 Unlock
Step: 3 Unlock