

Question: here is the graph ans the table , i am trying to calculate percent error but my number is way too high idk what i
here is the graph ans the table , i am trying to calculate percent error but my number is way too high idk what i did wrong 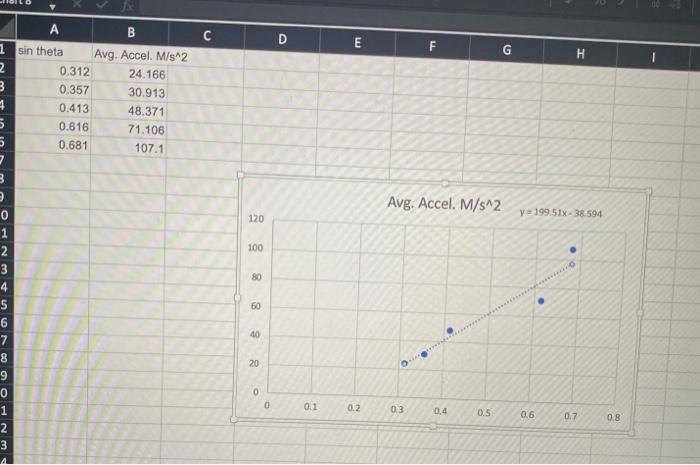
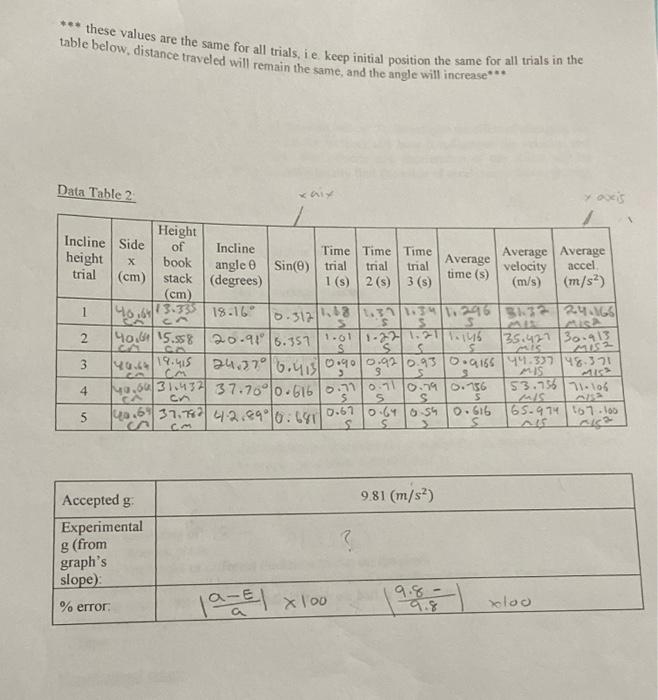
the slope of the graph is suppose to be my expimental g but i guess its to high , pleaseeee help
sin theta Avg. Accel. M/s2 c D F G H I \begin{tabular}{|r|r|} \hline 0.312 & 24.166 \\ \hline 0.357 & 30.913 \\ \hline 0.413 & 48.371 \\ \hline 0.616 & 71.106 \\ \hline 0.681 & 107.1 \\ \hline \end{tabular} Avg. Accel. M/s^2 y=199.51x38.594 these values are the same for all trials, i e keep initial position the same for all trials in the table below, distance traveled will remain the same, and the angle will increase
Step by Step Solution
There are 3 Steps involved in it
1 Expert Approved Answer
Step: 1 Unlock

Question Has Been Solved by an Expert!
Get step-by-step solutions from verified subject matter experts
Step: 2 Unlock
Step: 3 Unlock