

Question: Here is the information that i have been provided with Please help me with all 4 questions. I need help specifying the ratios that should
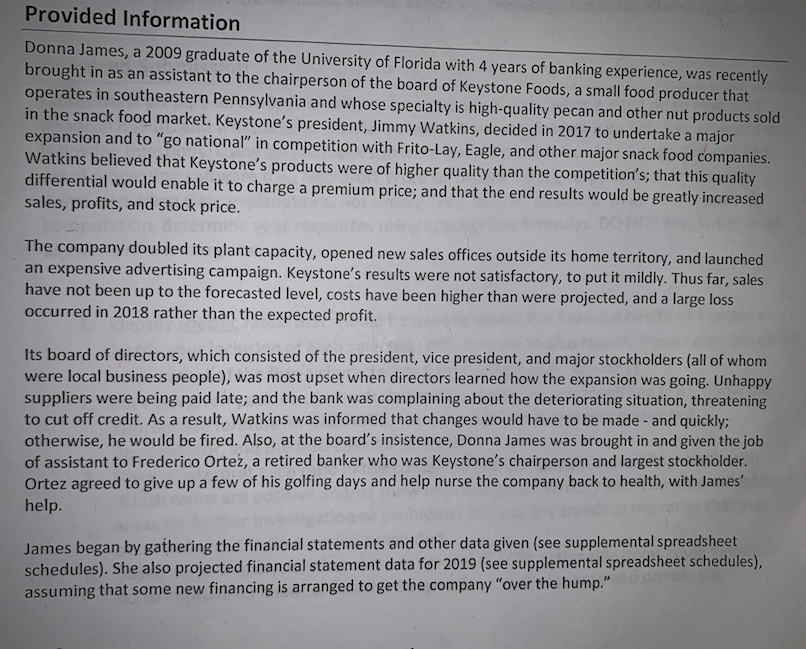

Here is the information that i have been provided with
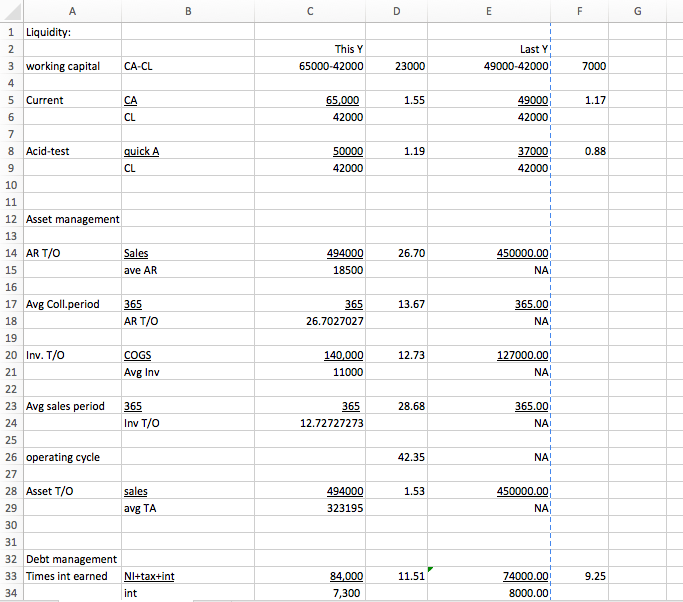

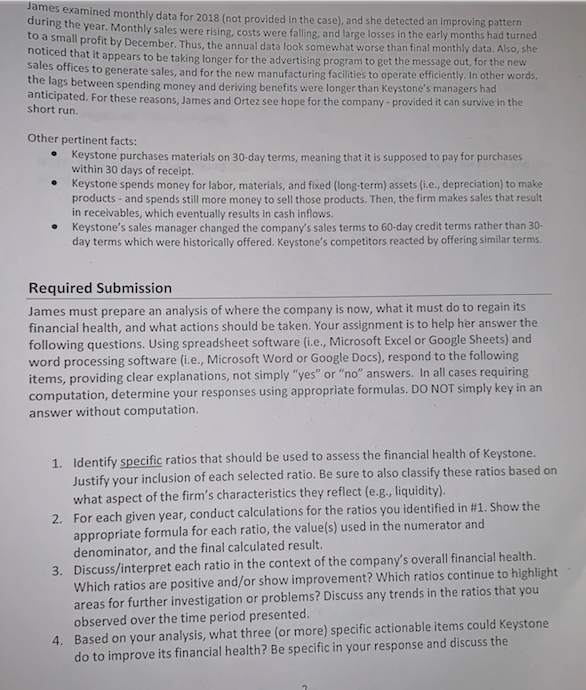
Please help me with all 4 questions. I need help specifying the ratios that should be used, need help with the calculations for the ratios specified of each given year (need to know the formula), and questions 3 and 4 please. Ive never made a financial statement analysis and i am a bit lost. Im not really sure where to start.
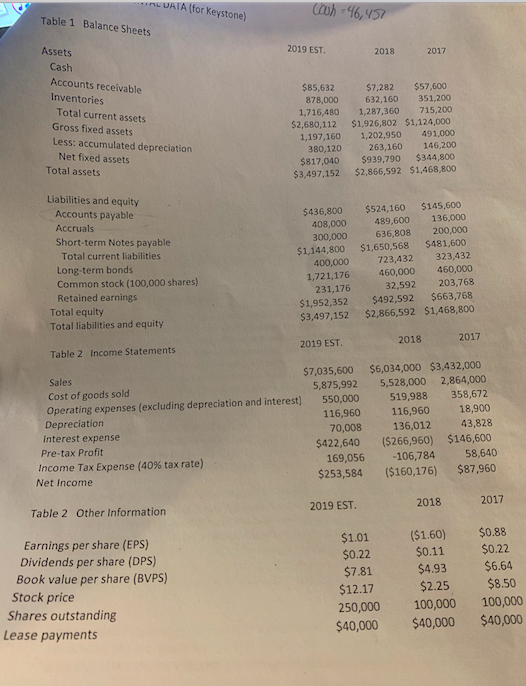
Table 1 Balance Sheets Assets 2019 EST. 2018 2017 Cash Accounts receivable Inventories Total current assets Gross fixed assets Less: accumulated depreciation $7,282 $57,600 632,160 351,200 1,716,480 1,287,360 715,200 $2,680,112 $1,926,802 $1,124,000 $85,632 878,000 1,197,160 1,202,950 491,000 263,160 146,200 380,120 $817,040 $939,790 $344,800 $3,497,152 $2,866,592 $1,468,800 Net fixed assets Total assets Liabilities and equity $436,800 $524,160 $145,600 Accounts payable Accruals Short-term Notes payable 408,000 489,600 136,000 300,000 636,808200,000 $1,144,800 $1,650,568 $481,600 Total current liabilities Long-term bonds Common stock (100,000 shares) Retained earnings 400,000 723,432 323,432 1,721,176 460,000 460,000 32,592 203,768 231,176 $1,952,352 $492,592 $663,768 $3,497,152 $2,866,592 $1,468,800 Total equity Total liabilities and equity 2018 2017 2019 EST Table 2 Income Statements $7,035,600 $6,034,000 $3,432,000 Sales Cost of goods sold Operating expenses (excluding depreciation and interest) Depreciation Interest expense 5,875,992 5,528,000 2,864,000 519,988 358,672 550,000 116960 116,960 18,900 70,008 136,012 43,828 $422,640 ($266,960) $146,600 169,056 106,784 58,640 $253,584 ($160,176) $87,960 Pre-tax Profit Income Tax Expense (40% tax rate) Net Income 2018 2017 2019 EST. Table 2 Other Information Earnings per share (EPS) Dividends per share (DPS) Book value per share (BVPS) $1.01 ($1.60) $0.88 $0.22 $7.81 $12.17 250,000 100,000 100,000 $0.11 $0.22 $4.93 $6.64 $2.25 $8.50 Stock price Shares outstanding Lease payments $40,000 $40,000 $40,000
Step by Step Solution
There are 3 Steps involved in it

Get step-by-step solutions from verified subject matter experts