

Question: here is the link to the excel worksheet. You will need to copy and paste. https://docs.google.com/spreadsheets/d/1a81N8gbbGnlBsUMBAqI6nKTPsd1rLoIp4IUNvi6sKAc/edit?usp=sharing a) What is the probability that the employee is
here is the link to the excel worksheet. You will need to copy and paste. https://docs.google.com/spreadsheets/d/1a81N8gbbGnlBsUMBAqI6nKTPsd1rLoIp4IUNvi6sKAc/edit?usp=sharing
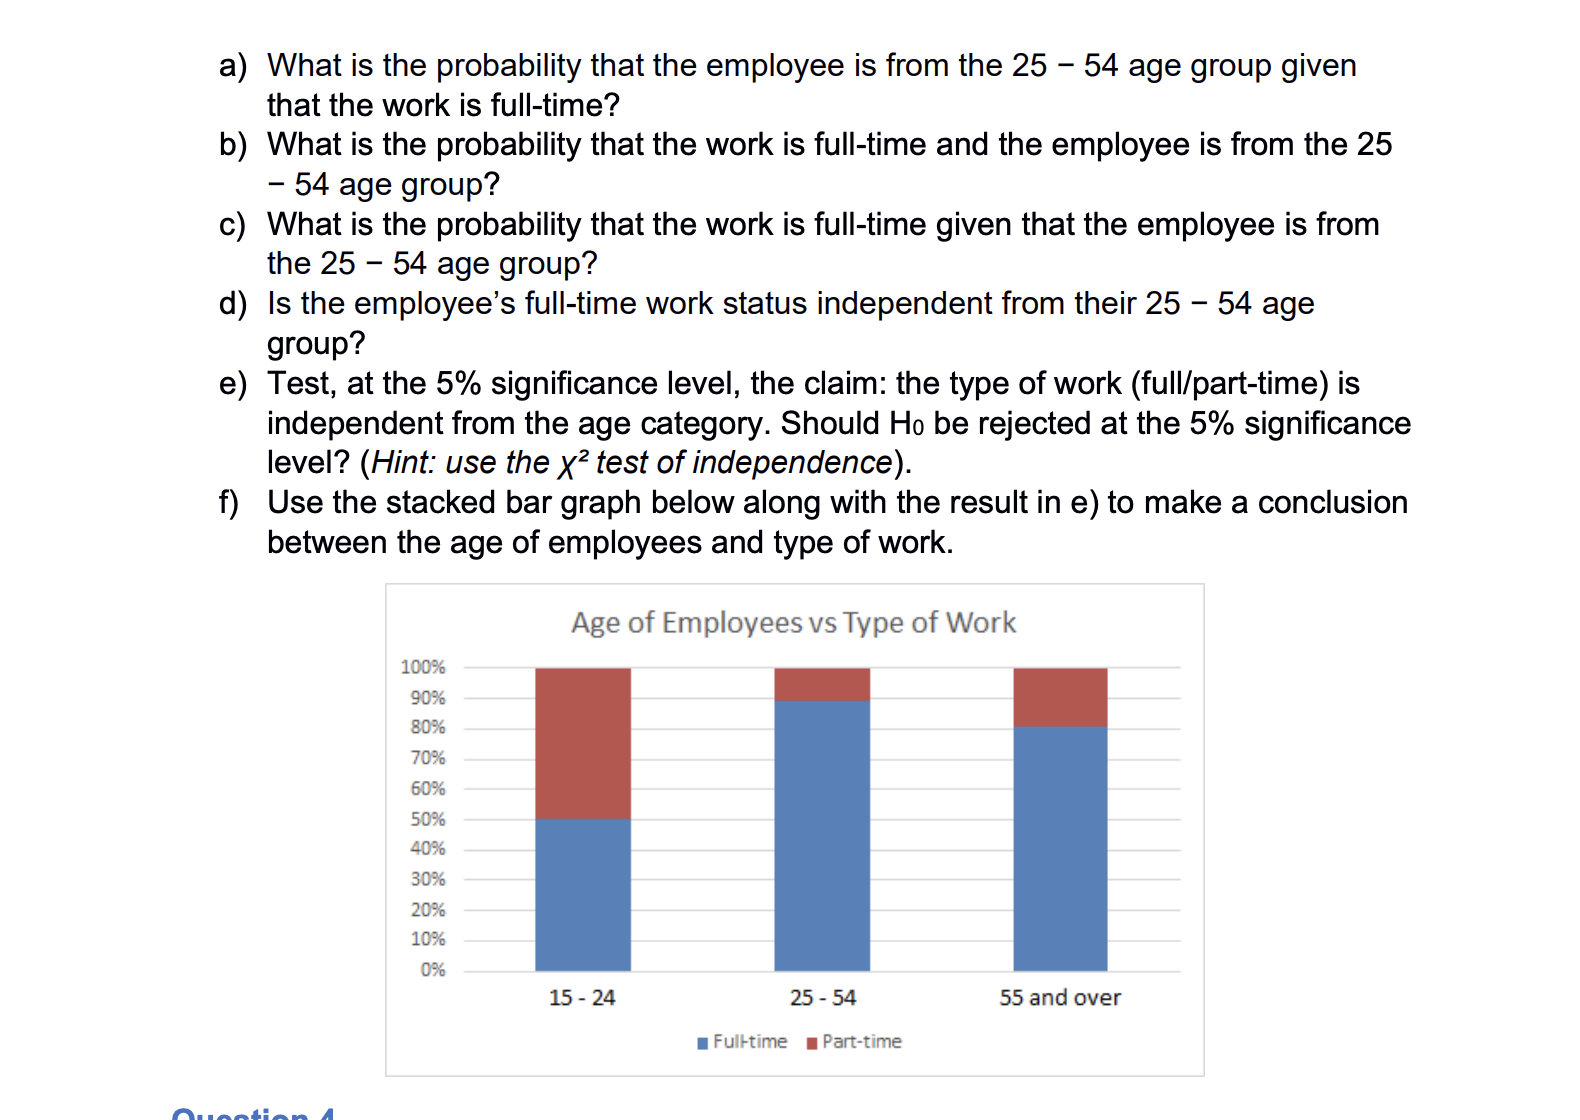
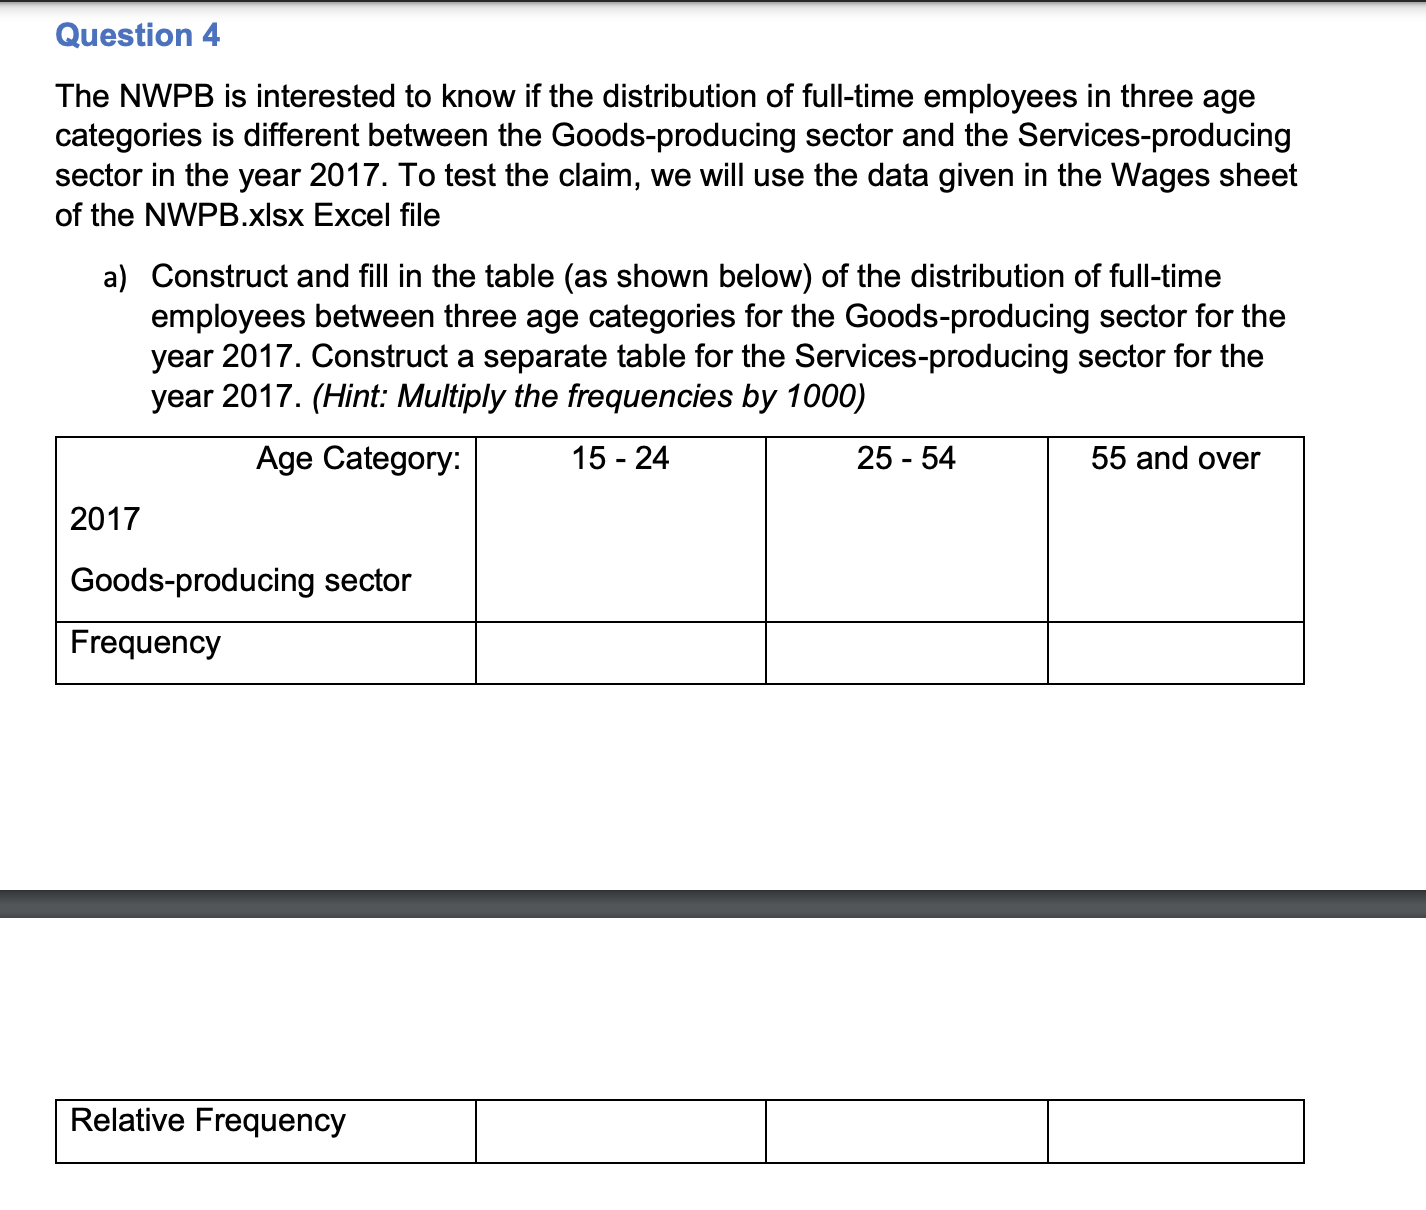
a) What is the probability that the employee is from the 25 - 54 age group given that the work is full-time? b) What is the probability that the work is full-time and the employee is from the 25 - 54 age group? c) What is the probability that the work is full-time given that the employee is from the 25 - 54 age group? d) Is the employee's full-time work status independent from their 25 - 54 age group? e) Test, at the 5% significance level, the claim: the type of work (full/part-time) is independent from the age category. Should Ho be rejected at the 5% signicance level? (Hint: use the X2 test of independence). f) Use the stacked bar graph below along with the result in e) to make a conclusion between the age of employees and type of work. Age of Employees vs Type of Work 15- 24 25-54 55 and over I FUII'tiI'DE I Parttime n. Inn':nn A Question 4 The NWPB is interested to know if the distribution of full-time employees in three age categories is different between the Goods-producing sector and the Services-producing sector in the year 2017. To test the claim, we will use the data given in the Wages sheet of the NWPB.xst Excel file a) Construct and fill in the table (as shown below) of the distribution of full-time employees between three age categories for the Goods-producing sector for the year 2017. Construct a separate table for the Services-producing sector for the year 2017. (Hint: Multiply the frequencies by 1000) Age Category: 15 24 25 - 54 55 and over 2017 Goods-producing sector
Step by Step Solution
There are 3 Steps involved in it

Get step-by-step solutions from verified subject matter experts