

Question: Here is the most current information on the consumer dynamics for the four major companies that participate in the Gallifrean Beer market. fNote: Cells highlighted
Here is the most current information on the consumer dynamics for the four major companies that participate in the Gallifrean Beer market.
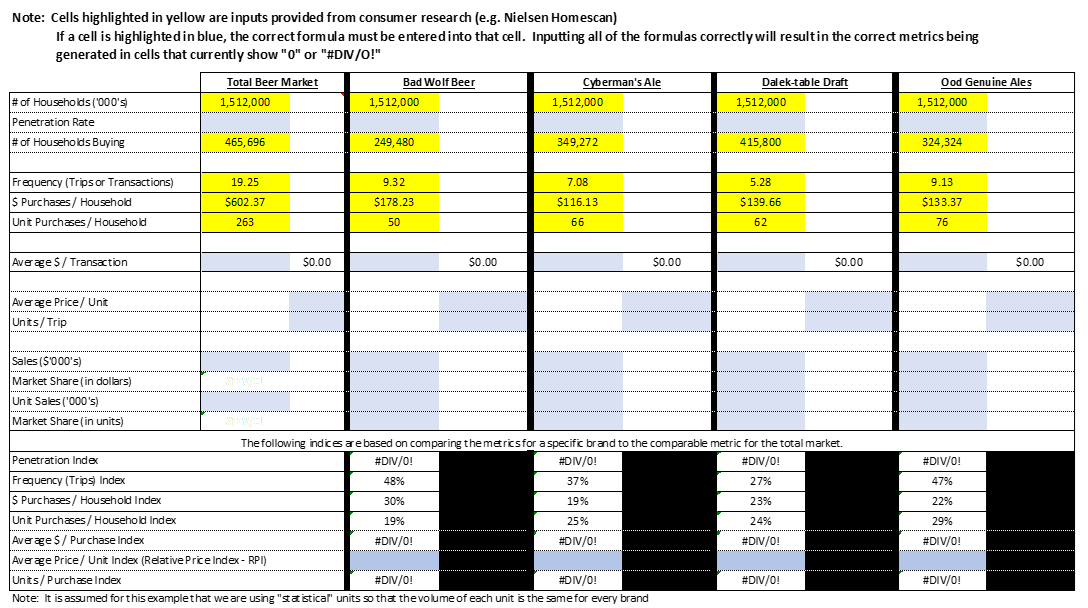
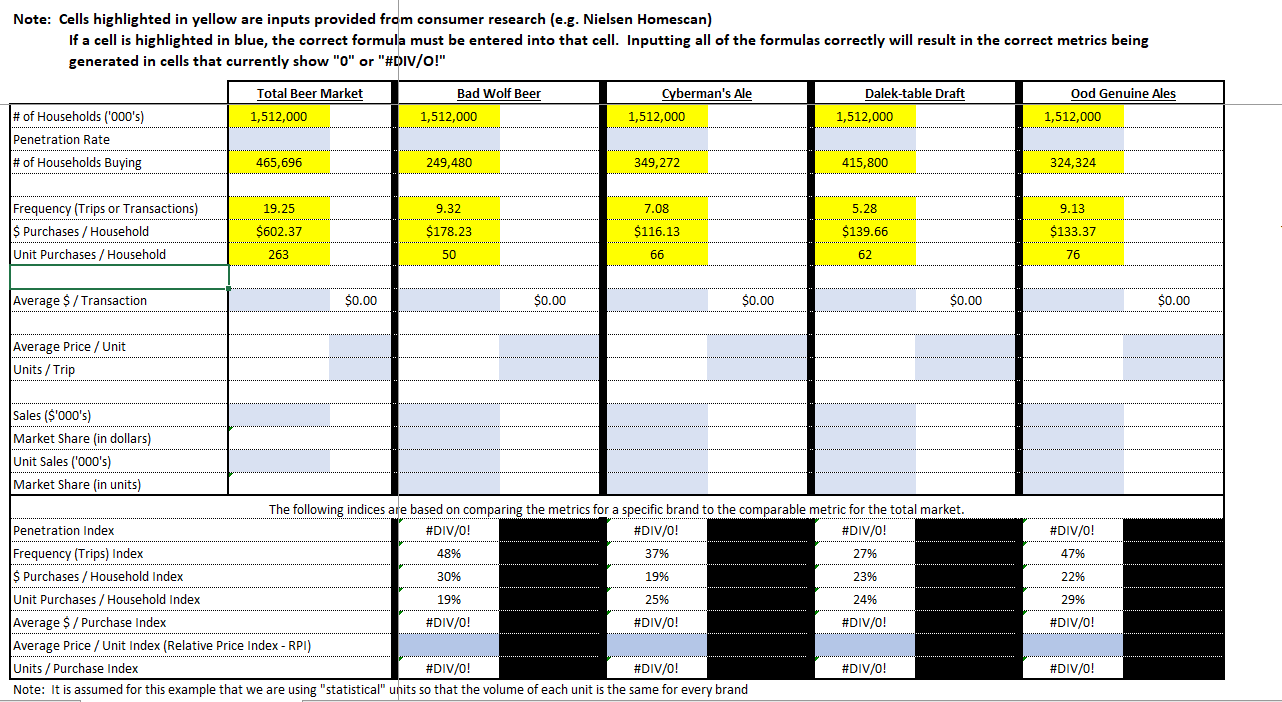
\fNote: Cells highlighted in yellow are inputs provided from consumer research (e.g. Nielsen Homescan) If a cell is highlighted in blue, the correct formula must be entered into that cell. Inputting all of the formulas correctly will result in the correct metrics being generated in cells that currently show "0" or "#DIV/O!" Total Beer Market Bad Wolf Beer Cyberman's Ale Dalek-table Draft Dod Genuine Ales # of Households ('000's) 1,512,000 1,512,000 1,512,000 1,512,000 1,512,000 Penetration Rate # of Households Buying 465,696 249,480 349,272 415,800 324,324 19.25 9.32 7.08 5.28 9.13 Frequency (Trips or Transactions) S Purchases / Household $602.37 S178.23 S116.13 S139.66 S133.37 Unit Purchases / Household 50 66 52 76 263 Average $ / Transaction 50.00 S0.00 50.00 50.00 50.00 Average Price / Unit Units / Trip Sales (S'000's) Market Share (in dollars Unit Sales ('000's Market Share (in units) The following indices are based on comparing the metrics for a specific brand to the comparable metric for the total market. #DIV/O! #DIV/O! #DIV/O! #DIV/O Penetration Index Frequency (Trips) Index 48% 37% 27% 47% $ Purchases / Household Index 30% 19% 23% 229% Unit Purchases / Household Index 19% 25% 49% 29% Average $ / Purchase Index #DIV/O! #DIV/O! #DIV/O! #DIV/O! Average Price / Unit Index (Relative Price Index - RPI) #DIV/O! #DIV/O! #DIV/O! #DIV/O! Units / Purchase Index Note: It is assumed for this example that we are using "statistical" units so that the volume of each unit is the same for every brand
Step by Step Solution
There are 3 Steps involved in it

Get step-by-step solutions from verified subject matter experts