

Question: here is the question 3. (a) A study was conducted to assess the effectiveness of a dict programme over time. More specifically, the number of

here is the question
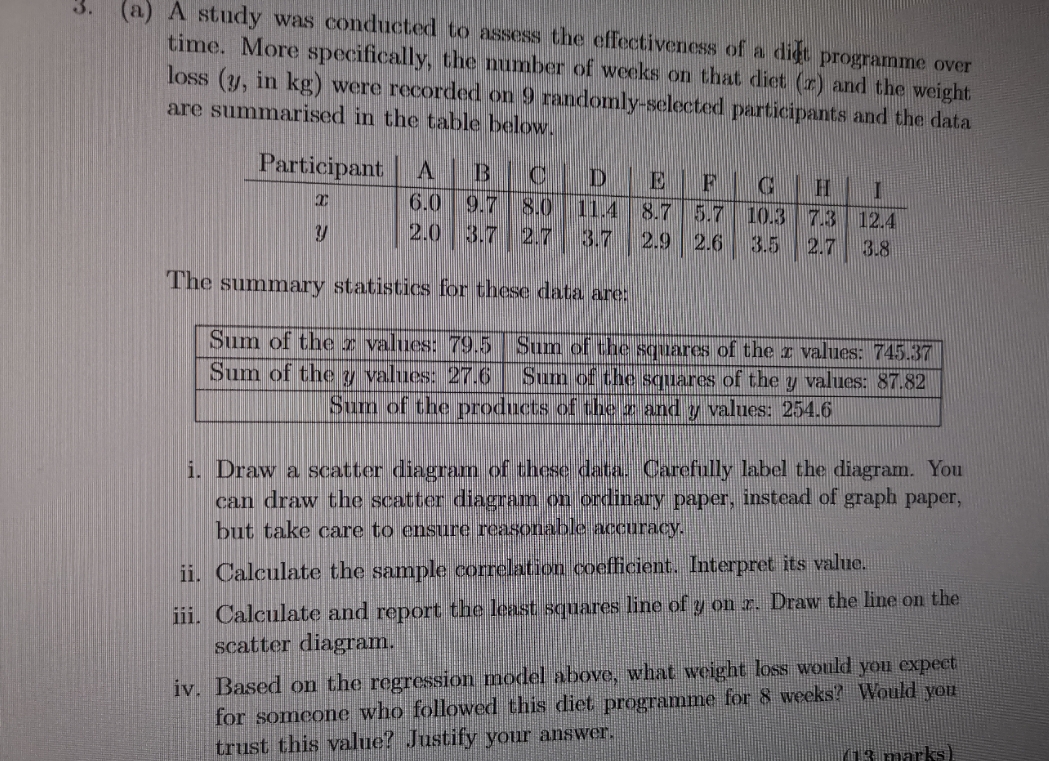
3. (a) A study was conducted to assess the effectiveness of a dict programme over time. More specifically, the number of weeks on that dict (r) and the weight loss (y, in kg) were recorded on 9 randomly-selected participants and the data are summarised in the table below. Participant A B C D 6.0 9.7 80 114 8.7 5.7 10.3 7.3 12.4 2.0 3.7 27 37 2.9 2.6 3.5 2.7 3.8 The summary statistics for these data are: Sum of the 2 values: 79.5|Sum of the squares of the I values: 745.37 Sum of the y values: 27.6 Sum of the squares of the y values: 87.82 Sum of the products of the a and y values: 254.6 i. Draw a scatter diagram of these data. Carefully label the diagram. You can draw the scatter diagram on ordinary paper, instead of graph paper, but take care to ensure reasonable accuracy. ii. Calculate the sample correlation coefficient. Interpret its value. iii. Calculate and report the least squares line of y on r. Draw the line on the scatter diagram. iv. Based on the regression model above, what weight loss would you expect for someone who followed this diet programme for 8 weeks? Would you trust this value? Justify your answer, marks
Step by Step Solution
There are 3 Steps involved in it

Get step-by-step solutions from verified subject matter experts