

Question: here is the question i am having a hard time with 1 IIP L C' 15. [-15 Points] HARMATHAP12 2.5.026. PRACI'ICE ANOTHER 111a following table
here is the question i am having a hard time with
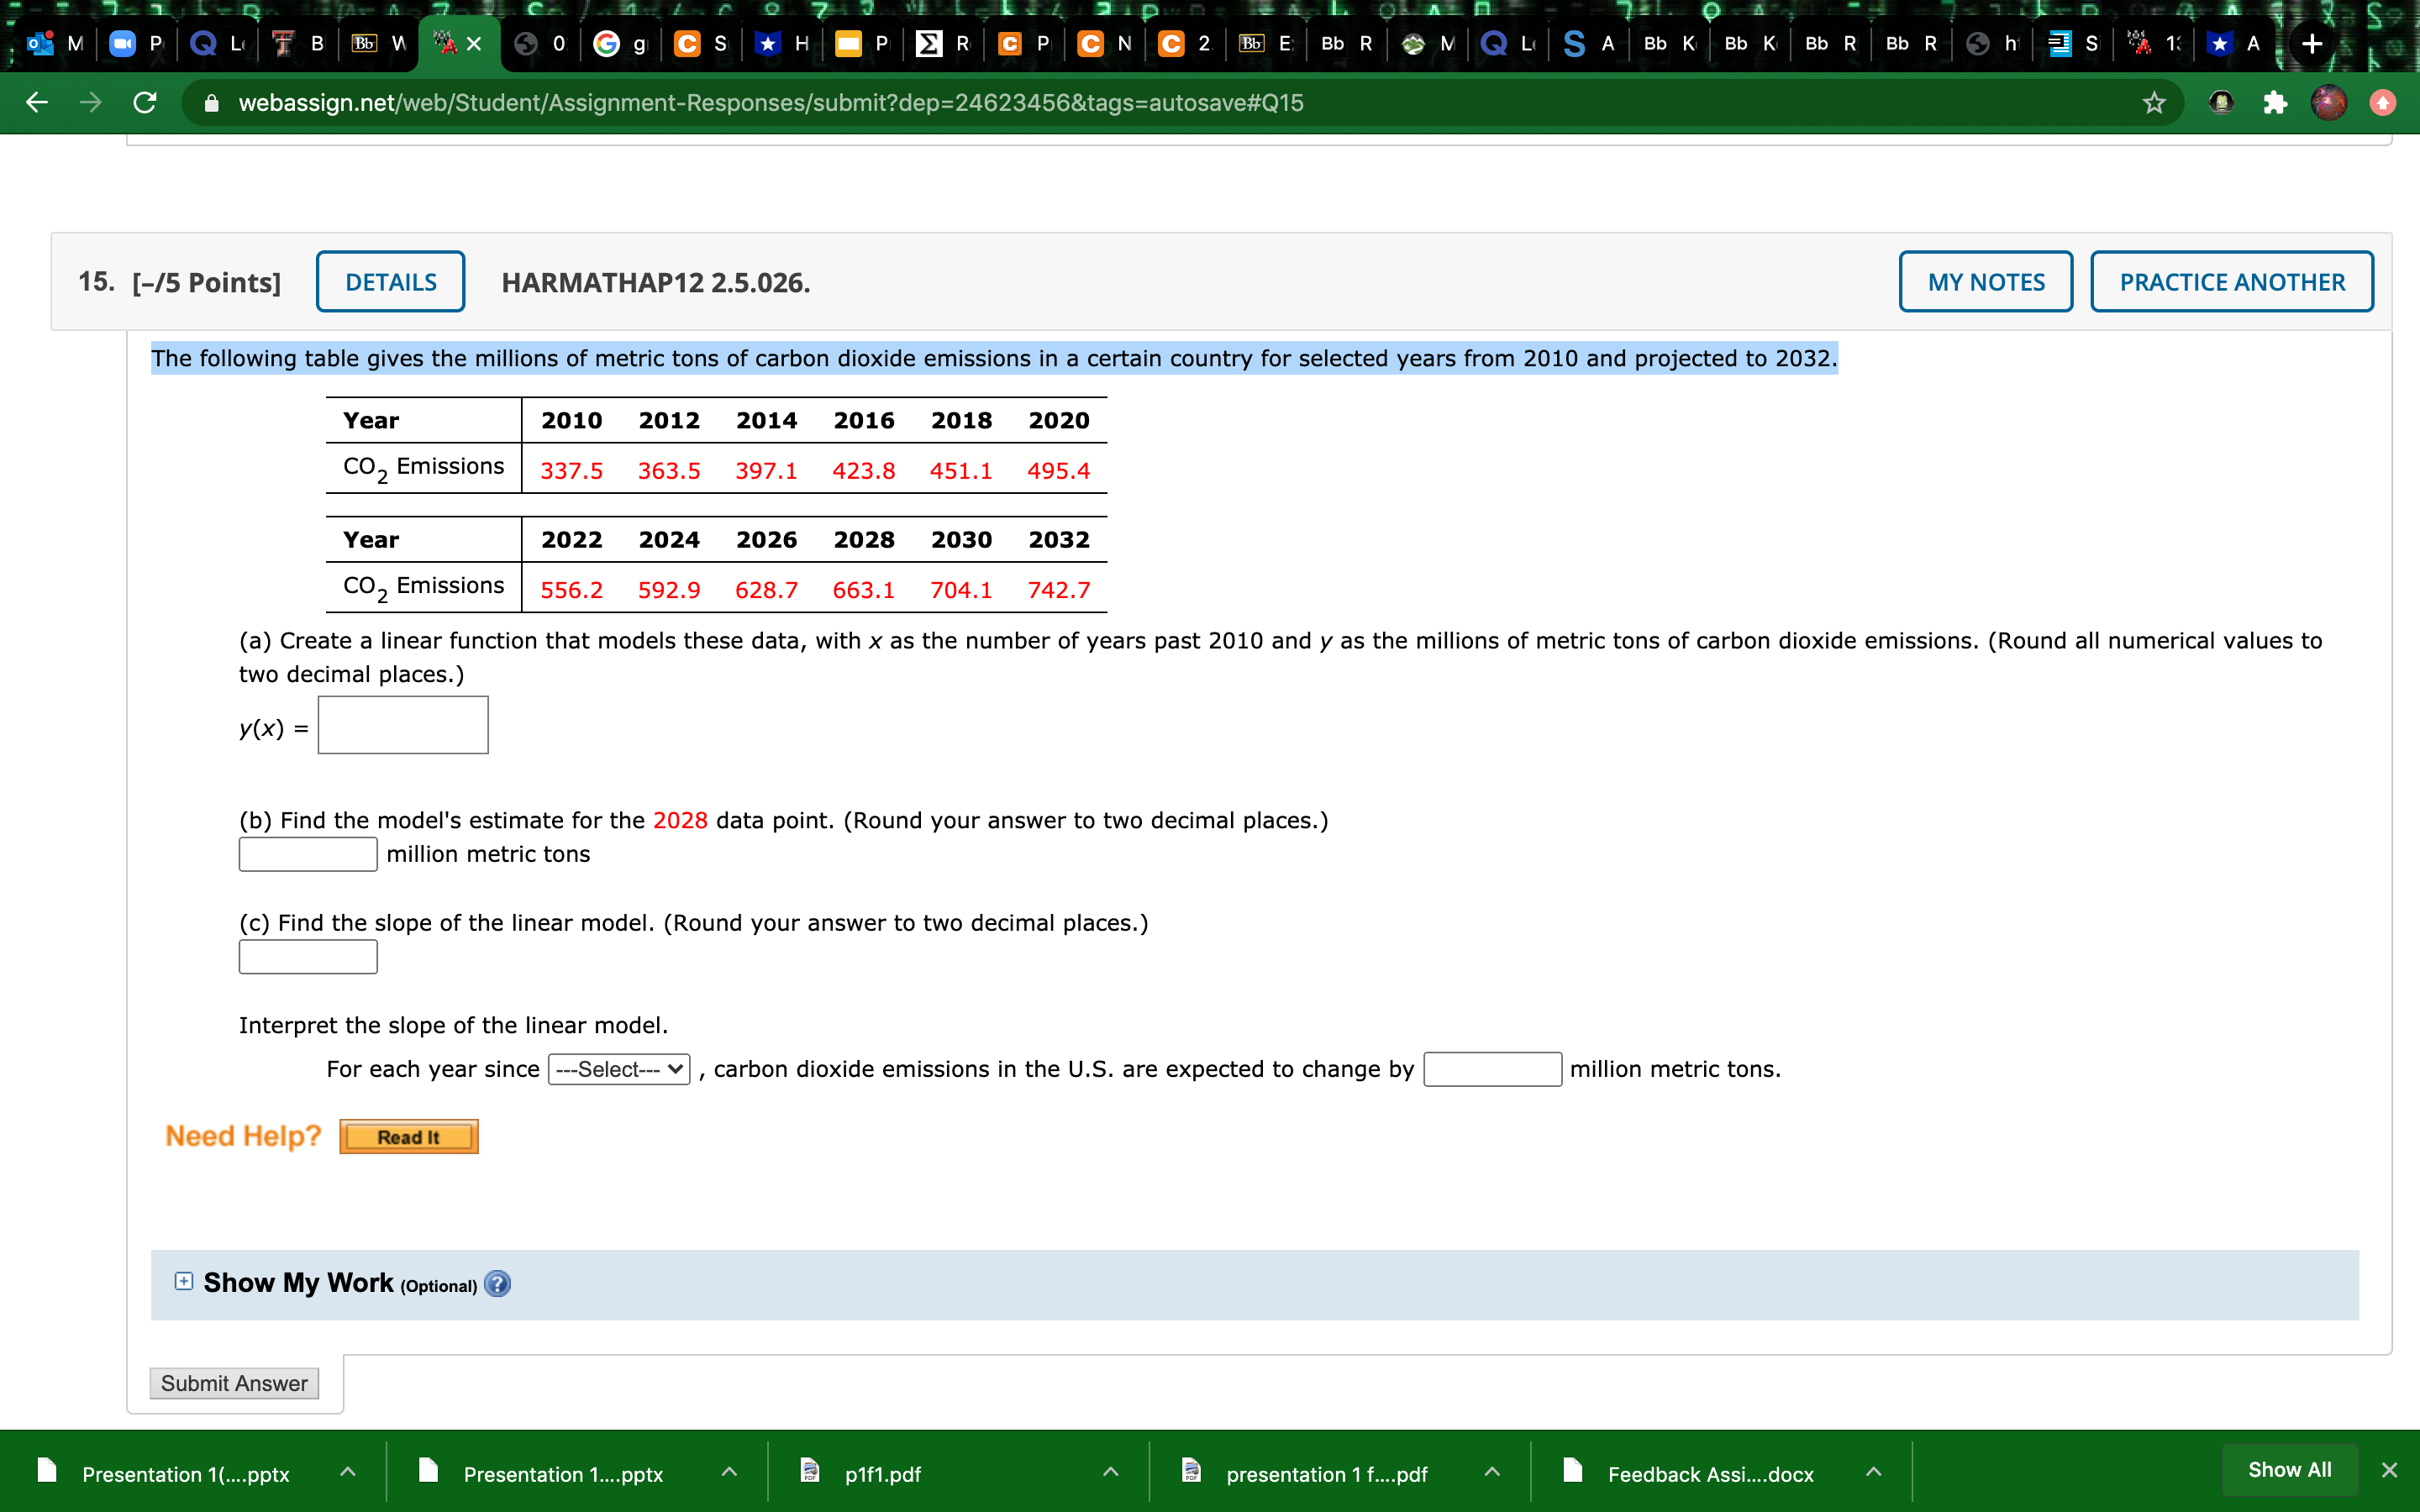
1 IIP L C' 15. [-15 Points] HARMATHAP12 2.5.026. PRACI'ICE ANOTHER 111a following table gives the millions of metric tons of carbon dioxide emissions in a oertain oountry for selected years from 2010 and projected to 2032. Year 2010 2012 2014 2016 2018 2020 COZEmissions 337.5 363.5 397.1 423.3 451.1 495.4 Year 2022 2024 2026 2028 2030 2032 COZEmissionS 556.2 592.9 628.7 663.1 704.1 742.7 (a) Create a linear function that models these data, with x as the number of years past 2010 and y as the millions of metric tons of carbon dioxide emissions. (Round all numerical values to two decimal places.) Y(X) = (b) Find the model's estimate for the 2028 data point. (Round your answer to two decimal places.) million metric tons (c) Find the slope of the linear model. (Round your answer to two decimal places.) Interpret the slope of the linear model. For each year since , carbon dioxide emissions in the U.S. are expected to change by million metric tons. Need Help? _' Show My Work (Optional) 0 Submit Answer Presentation 1 Presentation p El p1f1.pdf presentation 1 ' Show All
Step by Step Solution
There are 3 Steps involved in it

Get step-by-step solutions from verified subject matter experts