

Question: Here is the question: The figure below shows the graph of f', the derivative of the function f, on the closed interval from x=-2 to
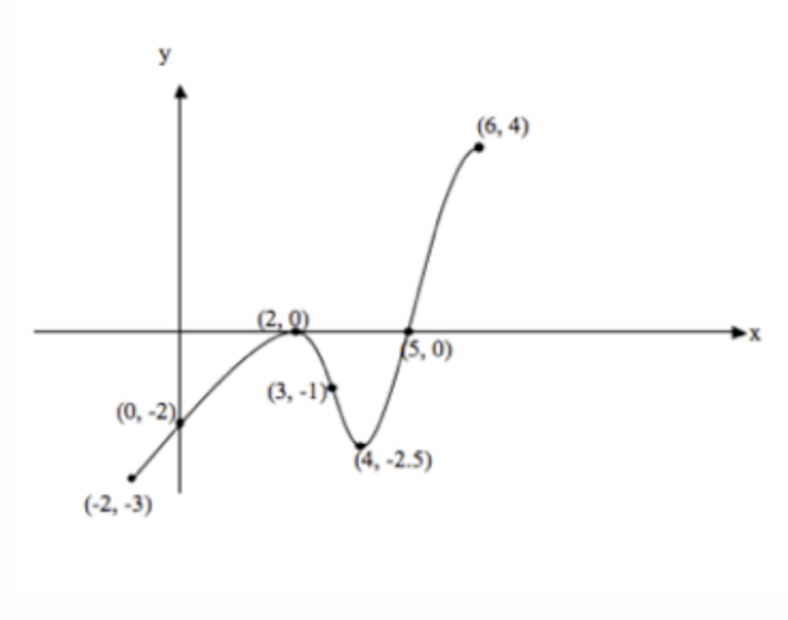
Here is the question: The figure below shows the graph of f', the derivative of the function f, on the closed interval from x=-2 to x=6. The graph of the derivative has horizontal tangent lines at x = 2 and x = 4. Find the x-value where f attains its absolute maximum value on the closed interval from x = -2 to x = 6. Justify your answer.
Can someone explain how I would go about trying to find the maximum value? Is there a certain way to go about doing it when given a graph rather than a function? I understand how to go about it when given just a plain function; however, I can't seem to figure how to do it when just given the graph. Can you explain how I would begin to solve a question like this one?
Here is the graph:
\f
Step by Step Solution
There are 3 Steps involved in it

Get step-by-step solutions from verified subject matter experts