

Question: Here is the script to work on. Use the same script when coding .Thanks. % Define a set of initial values omegaSubN = 5; zeta
Here is the script to work on. Use the same script when coding .Thanks.
% Define a set of initial values
omegaSubN = 5;
zeta = 0.4;
%add error handling here later to ensure correct omegaSubN and zeta input.
if (1) %we use 1 here to make it compile, you should change to the correct conditions
%First create vectors of values for the real, sigma, and imaginary, omega, parts of the complex variable s .
% Create a vector of sigma in the range with increasement of 0.1
sigma =
% Create a vector of omega in the range with increasement of 0.1
omega =
%Next create 2D grids using the vectors for sigma and omega and the meshgrid function.
[sigsig, omegaomega]=
%Create a 2D grid for s using the grids for sigsig and omegaomega. The values in s will be complex valued.
s =
%Evaluate the function F(s) for the grid s.
fs =
%Determine the magnitude of F(s) which should then be plotted versus the real and imaginary components of s.
%MATLAB has functions abs for determining the magnitude and real and imag for determining the real and imaginary components of complex numbers.
else
fprintf('Error: value of omega and zeta not within range');
end
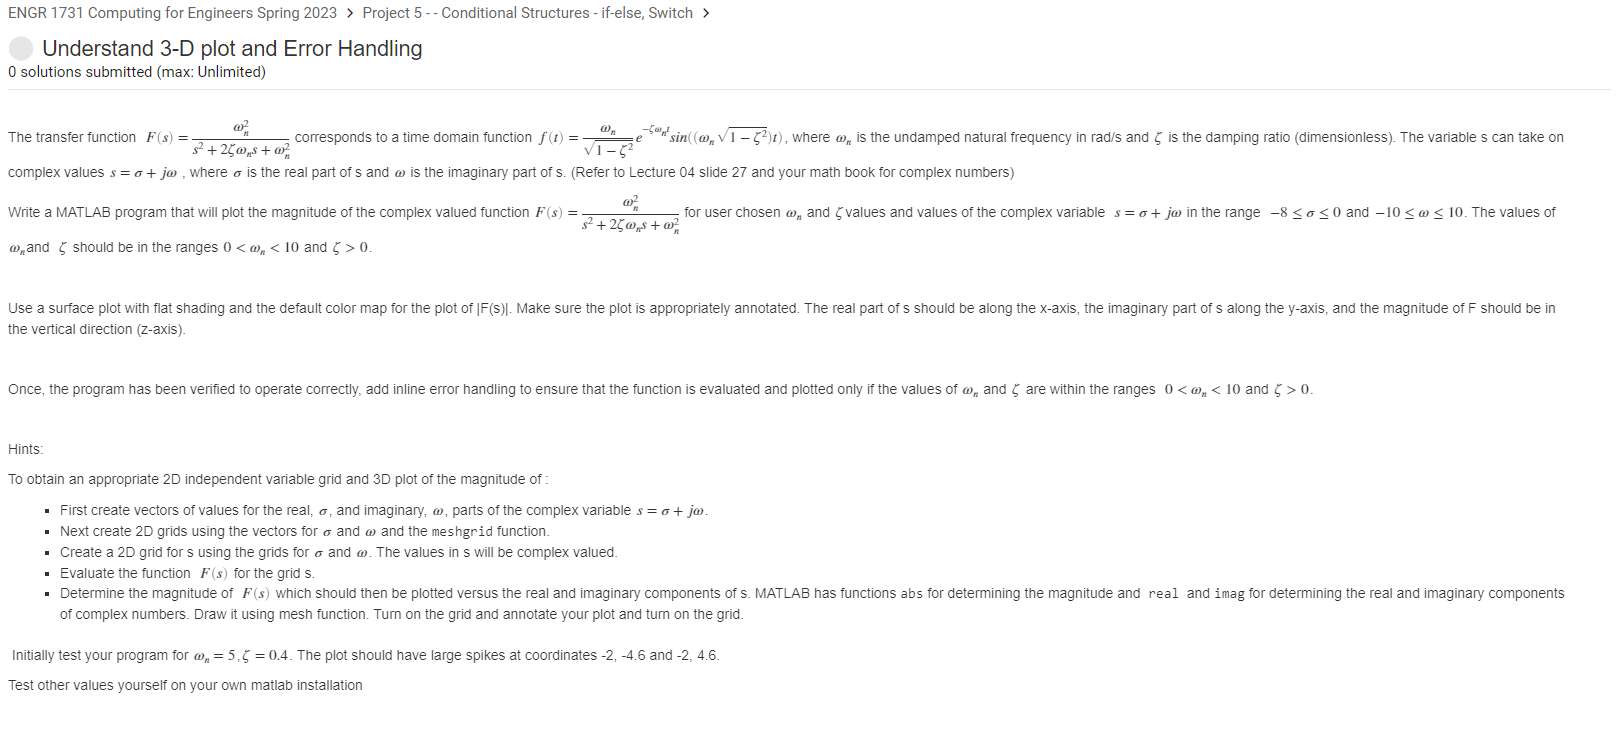
ENGR 1731 Computing for Engineers Spring 2023> Project 5 - - Conditional Structures - if-else, Switch > Understand 3-D plot and Error Handling 0 solutions submitted (max: Unlimited) complex values s=+j, where is the real part of s and is the imaginary part of s. (Refer to Lecture 04 slide 27 and your math book for complex numbers) n and should be in the ranges 0
Step by Step Solution
There are 3 Steps involved in it

Get step-by-step solutions from verified subject matter experts