

Question: Here is what I expect for you to complete: 1. Complete the forecasting exercise as instructed in the case. It helps first completing it by
Here is what I expect for you to complete:
1. Complete the forecasting exercise as instructed in the case. It helps first completing it by hand and then moving to the excel file provided. (no need to submit the hand written forecast)
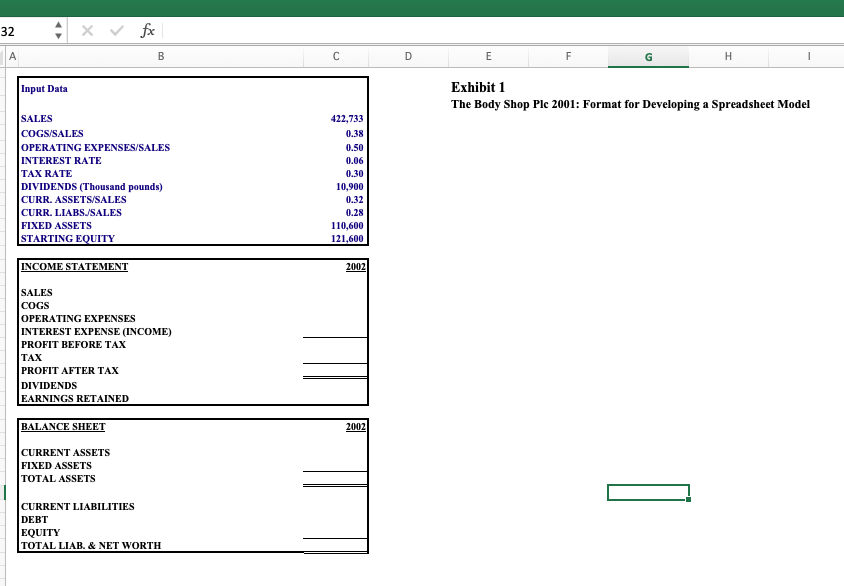
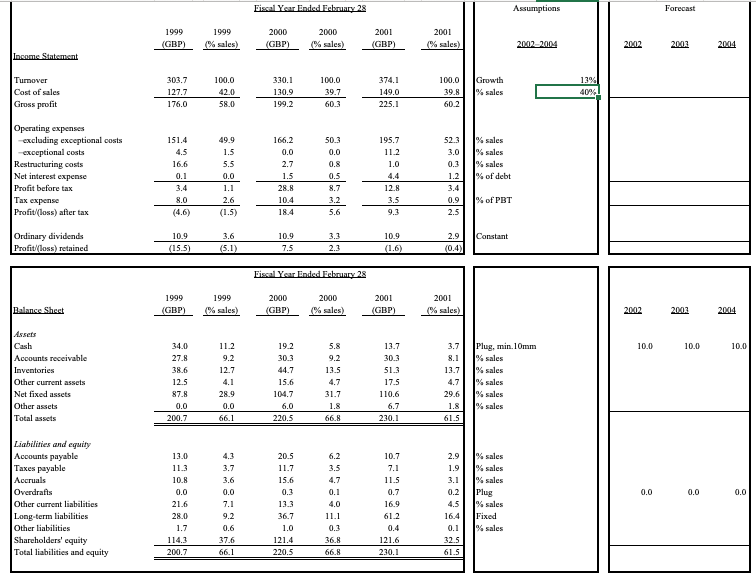
2. Complete Exhibits 1, 4, 6, 8 & 9. (Submit the excel file)
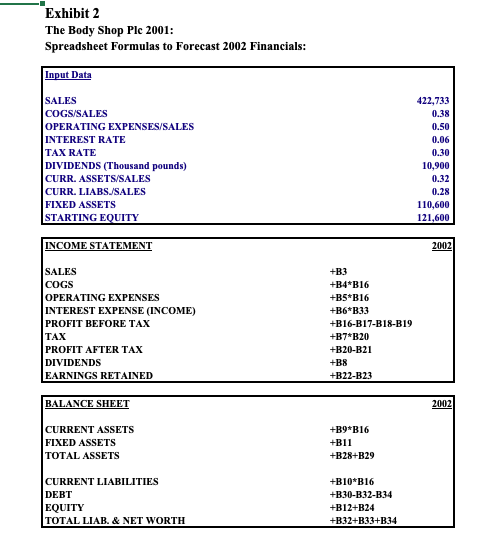
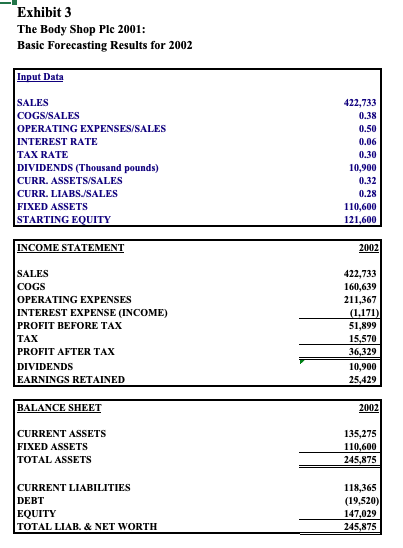
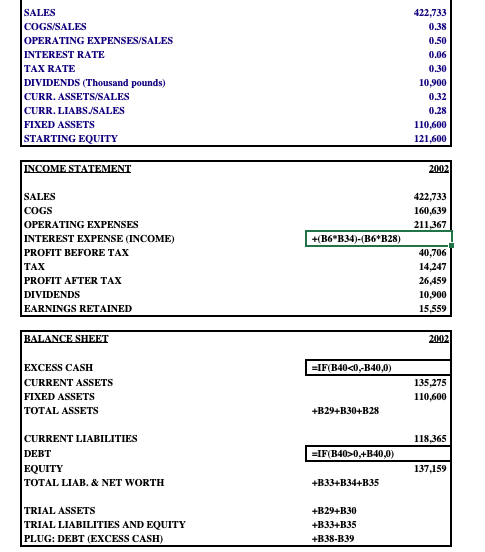
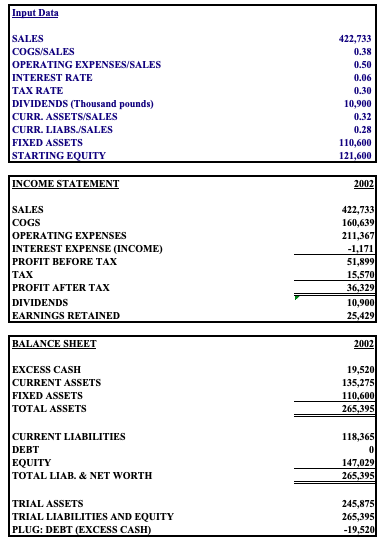
- Exhibit 1: You can look at Exhibit 2 references and check the values in Exhibit 3.
- Exhibit 4: See Exhibit 5 for guidance. (Ignore the referenced cells)
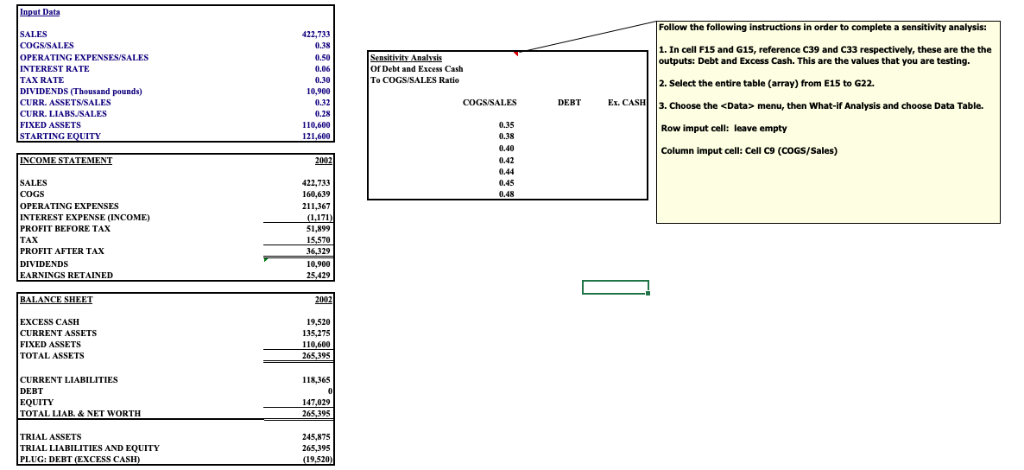
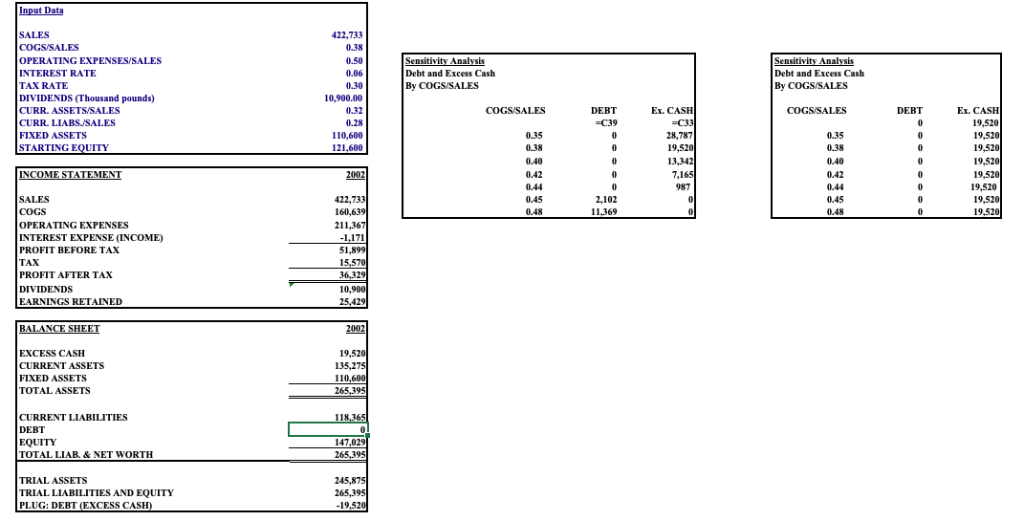
- Exhibit 6: Complete sensitivity analysis (Follow instructions from the note)
- Exhibit 8: Complete the forecast for 2002, 2003 and 2004, use the following assumptions:
- Sales growth: 13% (Make sure to reference this value on Cell P12 from Exhibit 9 Cell C2)
- Cost of good sold (COGS): 40% (Make sure to reference this value on Cell P13 from Exhibit 9 Cell C3)
- Operating expenses:
- excluding exceptional cost: 52% of sales
- exceptional cost: 0% of sales
- Restructuring cost: 0% of sales
- Interest expense: 6% of debt
- Tax expense: 30% of Profit before taxes
- Dividends: GBP10.9 constant (same as three previous years)
- Assets: You can use same % of sales as in 2001 for all the items
- Liabilities:
- Accounts payable: 4.0% of sales
- Taxes payable: 2.0% of sales
- Accruals: 3.5% of sales
- Other current liabilities: 4.0% sales
- Other liabilities: 0.10% of sales
Exhibit 9: Complete sensitivity analysis (Follow instructions from the note)
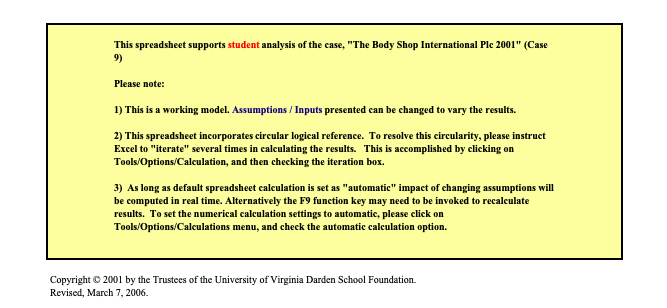
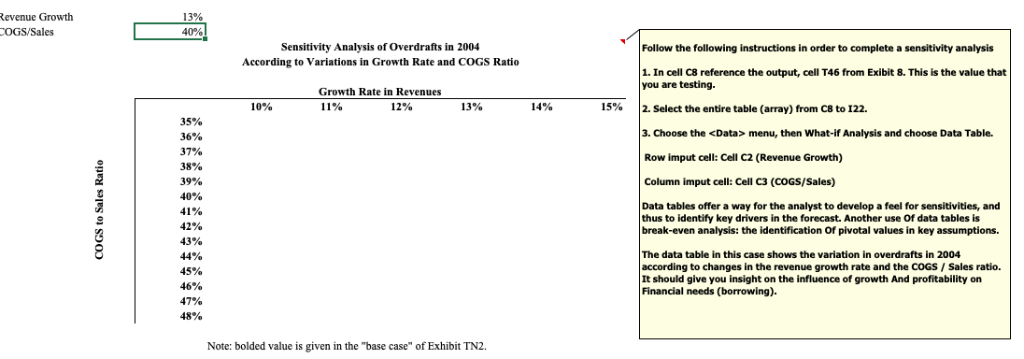
This spreadsheet supports student analysis of the case, "The Body Shop International Plc 2001" (Case 9) Please note: 1) This is a working model. Assumptions/Inputs presented can be changed to vary the results. 2) This spreadsheet incorporates circular logical reference. To resolve this circularity, please instruct Excel to "iterate" several times in calculating the results. This is accomplished by clicking on Tools Options/Calculation, and then checking the iteration box. 3) As long as default spreadsheet calculation is set as "automatic" impact of changing assumptions will be computed in real time. Alternatively the F9 function key may need to be invoked to recalculate results. To set the numerical calculation settings to automatic, please click on Tools Options/Calculations menu, and check the automatic calculation option. Copyright2001 by the Trustees of the University of Virginia Darden School Foundation. Revised, March 7, 2006 32 Exhibit 1 The Body Shop Plc 2001: Format for Developing a Spreadsheet Model Input Data SALES 422,733 OPERATING EXPENSES/SALES INTEREST RATE TAX RATE DIVIDENDS (Thousand pounds) CURR.ASSETS SALES CURR. LIABSJSALES FIXED ASSETS STARTING EOQUITY 0.50 0.06 10,900 0.32 0.28 110,600 121,600 INCOME STATEMENT COGS OPERATING EXPENSES INTEREST EXPENSE (INCOME) PROFIT BEFORE TAX TAX PROFIT AFTER TAX DIVIDENDS EARNINGS RETAINED CURRENT ASSETS FIXED ASSETS TOTAL ASSETS CURRENT LIABILITIES DEBT EQUITY TOTAL LIAB. &NET WORTH Exhibit 2 The Body Shop Plc 2001: Spreadsheet Formulas to Forecast 2002 Financials: Input Data SALES OPERATING EXPENSES/SALES INTEREST RATE TAX RATE DIVIDENDS (Thousand pounds) CURR.ASSETS SALES CURR. LIABSJSALES FIXED ASSETS STARTING EOQUITY 422,733 0.38 0.50 0.06 0.30 10,900 0.32 0.28 110,600 121,600 INCOME STATEMENT 2002 SALES COGS OPERATING EXPENSES INTEREST EXPENSE (INCOME) PROFIT BEFORE TAX TAX PROFIT AFTER TAX DIVIDENDS EARNINGS RETAINED B4*B16 B5*B16 B6 B33 +B16-B17-B18-B19 +B7 B20 820-B21 +B22-B23 BALANCE SHEET CURRENT ASSETS FIXED ASSETS TOTAL ASSETS +B9*B16 +B11 +B28+B29 CURRENT LIABILITIES DEBT EQUITY TOTAL LIAB. & NET WORTHH B10 B16 +B30-B32-B34 B12+B24 +B32+B33+B34 Exhibit 3 The Body Shop Plc 2001: Basic Forecasting Results for 2002 Input Data SALES COGS/SALES OPERATING EXPENSES/SALES INTEREST RATE TAX RATE DIVIDENDS (Thousand pounds) CURR.ASSETS SALES CURR. LIABSSALES FIXED ASSETS STARTING EOQUITY 422,733 0.38 0.50 0.06 0.30 10,900 0.32 0.28 110,600 121,600 INCOME STATEMENT SALES COGS OPERATING EXPENSES INTEREST EXPENSE (INCOME) PROFIT BEFORE TAX TAX PROFIT AFTER TAX DIVIDENDS EARNINGS RETAINED 422,733 160,639 211,367 1,171) 51,899 15,570 6,329 10,900 25,429 BALANCE SHEET CURRENT ASSETS FIXED ASSETS TOTAL ASSETS 135,275 110,600 245,875 CURRENT LIABILITIES DEBT EQUITY TOTAL LIAB. &NET WORTH 118,365 (19,520 147,029 245,875 422,733 0.38 0.50 0.06 0.30 10,900 0.32 0.28 110,600 121,600 COGSISALES OPERATING EXPENSES/SALES INTEREST RATE TAX RATE DIVIDENDS (Thousand pounds) CURR. ASSETS/SALES CURR. LIABSJSALES FIXED ASSETS STARTING EQUITY 422,733 160,639 211 OPERATING EXPENSES INTEREST EXPENSE (INCOME) PROFIT BEFORE TAx TAX PROFIT AFTER TAX DIVIDENDS EARNINGS RETAINED HB6 B34)-(B6 B28) 40.706 14.247 26459 10,900 15.559 EXCESS CASH CURRENT ASSETS FIXED ASSETS TOTAL ASSETS 135.275 110,600 +B29+B30+B28 CURRENT LIABILITIES DEBT EQUITY TOTAL LIAB. & NET WORTH 118.365 137,159 +B334B34+B35 TRIAL ASSETS TRIAL LIABILITIES AND EQUITY PLUG: DEBT (EXCESS CASH +B294B30 +B33+B35 +B38-B39 Input Data SALES COGS/SALES OPERATING EXPENSES/SALES INTEREST RATE TAX RATE DIVIDENDS (Thousand pounds) CURR.ASSETS SALES CURR. LIABSSALES FIXED ASSETS STARTING EOQUITY 422,733 0.38 0.50 0.06 0.30 10,900 0.32 0.28 110,600 121,600 INCOME TEMEN SALES COGS OPERATING EXPENSES INTEREST EXPENSE (INCOME) PROFIT BEFORE TAX TAX PROFIT AFTER TAX DIVIDENDS EARNINGS RETAINED 422,733 160,639 211,367 1,171 51,899 6,329 10,900 25,429 BALANCE SHEET EXCESS CASH CURRENT ASSETS FIXED ASSETS TOTAL ASSETS 19,520 135,275 110,600 265.395 CURRENT LIABILITIES DEBT EQUITY TOTAL LIAB. & NET WORTH 118,365 147,029 265.395 TRIAL ASSETS TRIAL LIABILITIES AND EQUITY PLUG: DEBT (EXCESS CASH 245,875 265.395 19,520 Follow the following instructions in order to complete a sensitivity analysis ALES COGS/SALES OPERATING EXPENSESISALES INTEREST RATE TAX RATE DIVIDENDS (Thousand pounds) CURR. ASSETSSALES CURR. LIABSUSALES FIXED ASSETS STARTING EOUITY 422,733 0.38 0.50 0.06 0.30 10,900 0.32 0.28 10,600 121,600 1. In cell F15 and G15, reference C39 and C33 respectively, these are the the outputs: Debt and Excess Cash. This are the values that you are testing. 2. Select the entire table (array) from E15 to G22 3. Choose the menu, then What-if Analysis and choose Data Table. Row imput cell: leave empty Column imput cell: Cell C9 (COGS/Sales) Of Debt and Excess Cash To COGS/SALES Ratie DEBT Ex. C 0.35 0.38 0.40 0.42 0,44 0.45 0.48 22,733 SALES COGS OPERATING EXPENSES INTEREST EXPENSE (INCOME) PROFIT BEFORE TAX TAX PROFIT AFTER TAX DIVIDENDS EARNINGS RETAINED 211,367 1,171 51,899 10,900 25,429 EXCESS CASH CURRENT ASSETS FIXED ASSETS TOTAL ASSETS 19,520 135,275 110,600 395 CURRENT LIABILITIES DEBT EQUITY TOTAL LIAR&NET WORTH 118,365 147,029 TRIAL ASSETS TRIAL LIABILITIES AND EQUITY PLUG: DEBT (EXCESS CASH 265,395 245,875 19,520) 422,733 COGS/SALES OPERATING EXPENSES/SALES INTEREST RATE TAX RATE DIVIDENDS (Thousand pounds) CURR. ASSETS/SALES CURR. LIABSUSALES FIXED ASSETS STARTING EOUITY Debt and Excess Cash Debt and Excess Cash 0.30 10,900.00 0.32 DEBT Ex. CASH DEBT Et. CASH 19,520 19,520 19,520 19,520 19,520 19,520 19,520 19,52 110,600 0.35 28,787 0.35 13,342 0.42 0.42 422,733 0.45 0.48 2,102 11,369 COGS OPERATING EXPENSES INTEREST EXPENSE (INCOME) PROFIT BEFORE TAx TAX PROFIT AFTER TAX DIVIDENDS EARNINGS RETAINED 0.48 211,36 1,171 51 15 10. 25,42 EXCESS CASH CURRENT ASSETS FIXED ASSETS TOTAL ASSETS 265.395 CURRENT LIABILITIES DEBT EQUITY TOTAL LIAB & NET WORTH TRIAL ASSETS TRIAL LIABILITIES AND EQUITY PLUG: DEBT (EXCESS CAS Forecast 2001 Turnover 374.1 39.8 %sales 225.1 1.2% of debt 0.9 % of PBT Profitloss) after tax 1.5 Profitloss) retained 1999 2001 2001 3.Plug, min.10mm 10.0 10.0 10.0 0.0 13% evenue Growth OGS/Sales Follow the following instructions in order to complete a sensitivity analysis Sensitivity Analysis of Overdrafts in 2004 According to Variations in Growth Rate and COGS Ratio 1. In cell C8 reference the output, cell T46 from Exibit 8. This is the value that you are testing. Growth Rate in Revenues 14% | 2. Select the entire table (array) from C8 to 122. 10% 11% 12% 13% 15% 3. Choose the menu, then What-if Analysis and choose Data Table. Row imput cell: Cell C2 (Revenue Growth) Column imput cell: Cell C3 (COGS/Sales) 35% 36% 37% 38% 39% 40% 41% 42% 43% 44% 45% 46% 47% 48% Data tables offer a way for the analyst to develop a feel for sensitivities, and thus to identify key drivers in the forecast. Another use of data tables is break-even analysis: the identification Of pivotal values in key assumptions. The data table in this case shows the variation in overdrafts in 2004 according to changes in the revenue growth rate and the COGS/Sales ratio. It should give you insight on the influence of growth And profitability on Financial needs (borrowing). Note: bolded value is given in the "base case" of Exhibit TN2 This spreadsheet supports student analysis of the case, "The Body Shop International Plc 2001" (Case 9) Please note: 1) This is a working model. Assumptions/Inputs presented can be changed to vary the results. 2) This spreadsheet incorporates circular logical reference. To resolve this circularity, please instruct Excel to "iterate" several times in calculating the results. This is accomplished by clicking on Tools Options/Calculation, and then checking the iteration box. 3) As long as default spreadsheet calculation is set as "automatic" impact of changing assumptions will be computed in real time. Alternatively the F9 function key may need to be invoked to recalculate results. To set the numerical calculation settings to automatic, please click on Tools Options/Calculations menu, and check the automatic calculation option. Copyright2001 by the Trustees of the University of Virginia Darden School Foundation. Revised, March 7, 2006 32 Exhibit 1 The Body Shop Plc 2001: Format for Developing a Spreadsheet Model Input Data SALES 422,733 OPERATING EXPENSES/SALES INTEREST RATE TAX RATE DIVIDENDS (Thousand pounds) CURR.ASSETS SALES CURR. LIABSJSALES FIXED ASSETS STARTING EOQUITY 0.50 0.06 10,900 0.32 0.28 110,600 121,600 INCOME STATEMENT COGS OPERATING EXPENSES INTEREST EXPENSE (INCOME) PROFIT BEFORE TAX TAX PROFIT AFTER TAX DIVIDENDS EARNINGS RETAINED CURRENT ASSETS FIXED ASSETS TOTAL ASSETS CURRENT LIABILITIES DEBT EQUITY TOTAL LIAB. &NET WORTH Exhibit 2 The Body Shop Plc 2001: Spreadsheet Formulas to Forecast 2002 Financials: Input Data SALES OPERATING EXPENSES/SALES INTEREST RATE TAX RATE DIVIDENDS (Thousand pounds) CURR.ASSETS SALES CURR. LIABSJSALES FIXED ASSETS STARTING EOQUITY 422,733 0.38 0.50 0.06 0.30 10,900 0.32 0.28 110,600 121,600 INCOME STATEMENT 2002 SALES COGS OPERATING EXPENSES INTEREST EXPENSE (INCOME) PROFIT BEFORE TAX TAX PROFIT AFTER TAX DIVIDENDS EARNINGS RETAINED B4*B16 B5*B16 B6 B33 +B16-B17-B18-B19 +B7 B20 820-B21 +B22-B23 BALANCE SHEET CURRENT ASSETS FIXED ASSETS TOTAL ASSETS +B9*B16 +B11 +B28+B29 CURRENT LIABILITIES DEBT EQUITY TOTAL LIAB. & NET WORTHH B10 B16 +B30-B32-B34 B12+B24 +B32+B33+B34 Exhibit 3 The Body Shop Plc 2001: Basic Forecasting Results for 2002 Input Data SALES COGS/SALES OPERATING EXPENSES/SALES INTEREST RATE TAX RATE DIVIDENDS (Thousand pounds) CURR.ASSETS SALES CURR. LIABSSALES FIXED ASSETS STARTING EOQUITY 422,733 0.38 0.50 0.06 0.30 10,900 0.32 0.28 110,600 121,600 INCOME STATEMENT SALES COGS OPERATING EXPENSES INTEREST EXPENSE (INCOME) PROFIT BEFORE TAX TAX PROFIT AFTER TAX DIVIDENDS EARNINGS RETAINED 422,733 160,639 211,367 1,171) 51,899 15,570 6,329 10,900 25,429 BALANCE SHEET CURRENT ASSETS FIXED ASSETS TOTAL ASSETS 135,275 110,600 245,875 CURRENT LIABILITIES DEBT EQUITY TOTAL LIAB. &NET WORTH 118,365 (19,520 147,029 245,875 422,733 0.38 0.50 0.06 0.30 10,900 0.32 0.28 110,600 121,600 COGSISALES OPERATING EXPENSES/SALES INTEREST RATE TAX RATE DIVIDENDS (Thousand pounds) CURR. ASSETS/SALES CURR. LIABSJSALES FIXED ASSETS STARTING EQUITY 422,733 160,639 211 OPERATING EXPENSES INTEREST EXPENSE (INCOME) PROFIT BEFORE TAx TAX PROFIT AFTER TAX DIVIDENDS EARNINGS RETAINED HB6 B34)-(B6 B28) 40.706 14.247 26459 10,900 15.559 EXCESS CASH CURRENT ASSETS FIXED ASSETS TOTAL ASSETS 135.275 110,600 +B29+B30+B28 CURRENT LIABILITIES DEBT EQUITY TOTAL LIAB. & NET WORTH 118.365 137,159 +B334B34+B35 TRIAL ASSETS TRIAL LIABILITIES AND EQUITY PLUG: DEBT (EXCESS CASH +B294B30 +B33+B35 +B38-B39 Input Data SALES COGS/SALES OPERATING EXPENSES/SALES INTEREST RATE TAX RATE DIVIDENDS (Thousand pounds) CURR.ASSETS SALES CURR. LIABSSALES FIXED ASSETS STARTING EOQUITY 422,733 0.38 0.50 0.06 0.30 10,900 0.32 0.28 110,600 121,600 INCOME TEMEN SALES COGS OPERATING EXPENSES INTEREST EXPENSE (INCOME) PROFIT BEFORE TAX TAX PROFIT AFTER TAX DIVIDENDS EARNINGS RETAINED 422,733 160,639 211,367 1,171 51,899 6,329 10,900 25,429 BALANCE SHEET EXCESS CASH CURRENT ASSETS FIXED ASSETS TOTAL ASSETS 19,520 135,275 110,600 265.395 CURRENT LIABILITIES DEBT EQUITY TOTAL LIAB. & NET WORTH 118,365 147,029 265.395 TRIAL ASSETS TRIAL LIABILITIES AND EQUITY PLUG: DEBT (EXCESS CASH 245,875 265.395 19,520 Follow the following instructions in order to complete a sensitivity analysis ALES COGS/SALES OPERATING EXPENSESISALES INTEREST RATE TAX RATE DIVIDENDS (Thousand pounds) CURR. ASSETSSALES CURR. LIABSUSALES FIXED ASSETS STARTING EOUITY 422,733 0.38 0.50 0.06 0.30 10,900 0.32 0.28 10,600 121,600 1. In cell F15 and G15, reference C39 and C33 respectively, these are the the outputs: Debt and Excess Cash. This are the values that you are testing. 2. Select the entire table (array) from E15 to G22 3. Choose the menu, then What-if Analysis and choose Data Table. Row imput cell: leave empty Column imput cell: Cell C9 (COGS/Sales) Of Debt and Excess Cash To COGS/SALES Ratie DEBT Ex. C 0.35 0.38 0.40 0.42 0,44 0.45 0.48 22,733 SALES COGS OPERATING EXPENSES INTEREST EXPENSE (INCOME) PROFIT BEFORE TAX TAX PROFIT AFTER TAX DIVIDENDS EARNINGS RETAINED 211,367 1,171 51,899 10,900 25,429 EXCESS CASH CURRENT ASSETS FIXED ASSETS TOTAL ASSETS 19,520 135,275 110,600 395 CURRENT LIABILITIES DEBT EQUITY TOTAL LIAR&NET WORTH 118,365 147,029 TRIAL ASSETS TRIAL LIABILITIES AND EQUITY PLUG: DEBT (EXCESS CASH 265,395 245,875 19,520) 422,733 COGS/SALES OPERATING EXPENSES/SALES INTEREST RATE TAX RATE DIVIDENDS (Thousand pounds) CURR. ASSETS/SALES CURR. LIABSUSALES FIXED ASSETS STARTING EOUITY Debt and Excess Cash Debt and Excess Cash 0.30 10,900.00 0.32 DEBT Ex. CASH DEBT Et. CASH 19,520 19,520 19,520 19,520 19,520 19,520 19,520 19,52 110,600 0.35 28,787 0.35 13,342 0.42 0.42 422,733 0.45 0.48 2,102 11,369 COGS OPERATING EXPENSES INTEREST EXPENSE (INCOME) PROFIT BEFORE TAx TAX PROFIT AFTER TAX DIVIDENDS EARNINGS RETAINED 0.48 211,36 1,171 51 15 10. 25,42 EXCESS CASH CURRENT ASSETS FIXED ASSETS TOTAL ASSETS 265.395 CURRENT LIABILITIES DEBT EQUITY TOTAL LIAB & NET WORTH TRIAL ASSETS TRIAL LIABILITIES AND EQUITY PLUG: DEBT (EXCESS CAS Forecast 2001 Turnover 374.1 39.8 %sales 225.1 1.2% of debt 0.9 % of PBT Profitloss) after tax 1.5 Profitloss) retained 1999 2001 2001 3.Plug, min.10mm 10.0 10.0 10.0 0.0 13% evenue Growth OGS/Sales Follow the following instructions in order to complete a sensitivity analysis Sensitivity Analysis of Overdrafts in 2004 According to Variations in Growth Rate and COGS Ratio 1. In cell C8 reference the output, cell T46 from Exibit 8. This is the value that you are testing. Growth Rate in Revenues 14% | 2. Select the entire table (array) from C8 to 122. 10% 11% 12% 13% 15% 3. Choose the menu, then What-if Analysis and choose Data Table. Row imput cell: Cell C2 (Revenue Growth) Column imput cell: Cell C3 (COGS/Sales) 35% 36% 37% 38% 39% 40% 41% 42% 43% 44% 45% 46% 47% 48% Data tables offer a way for the analyst to develop a feel for sensitivities, and thus to identify key drivers in the forecast. Another use of data tables is break-even analysis: the identification Of pivotal values in key assumptions. The data table in this case shows the variation in overdrafts in 2004 according to changes in the revenue growth rate and the COGS/Sales ratio. It should give you insight on the influence of growth And profitability on Financial needs (borrowing). Note: bolded value is given in the "base case" of Exhibit TN2
Step by Step Solution
There are 3 Steps involved in it

Get step-by-step solutions from verified subject matter experts